
 Facebook
 X
X
 Pinterest
 Copy Link
February Stats for King & Snohomish Counties Have Posted and There is a Story to Tell!
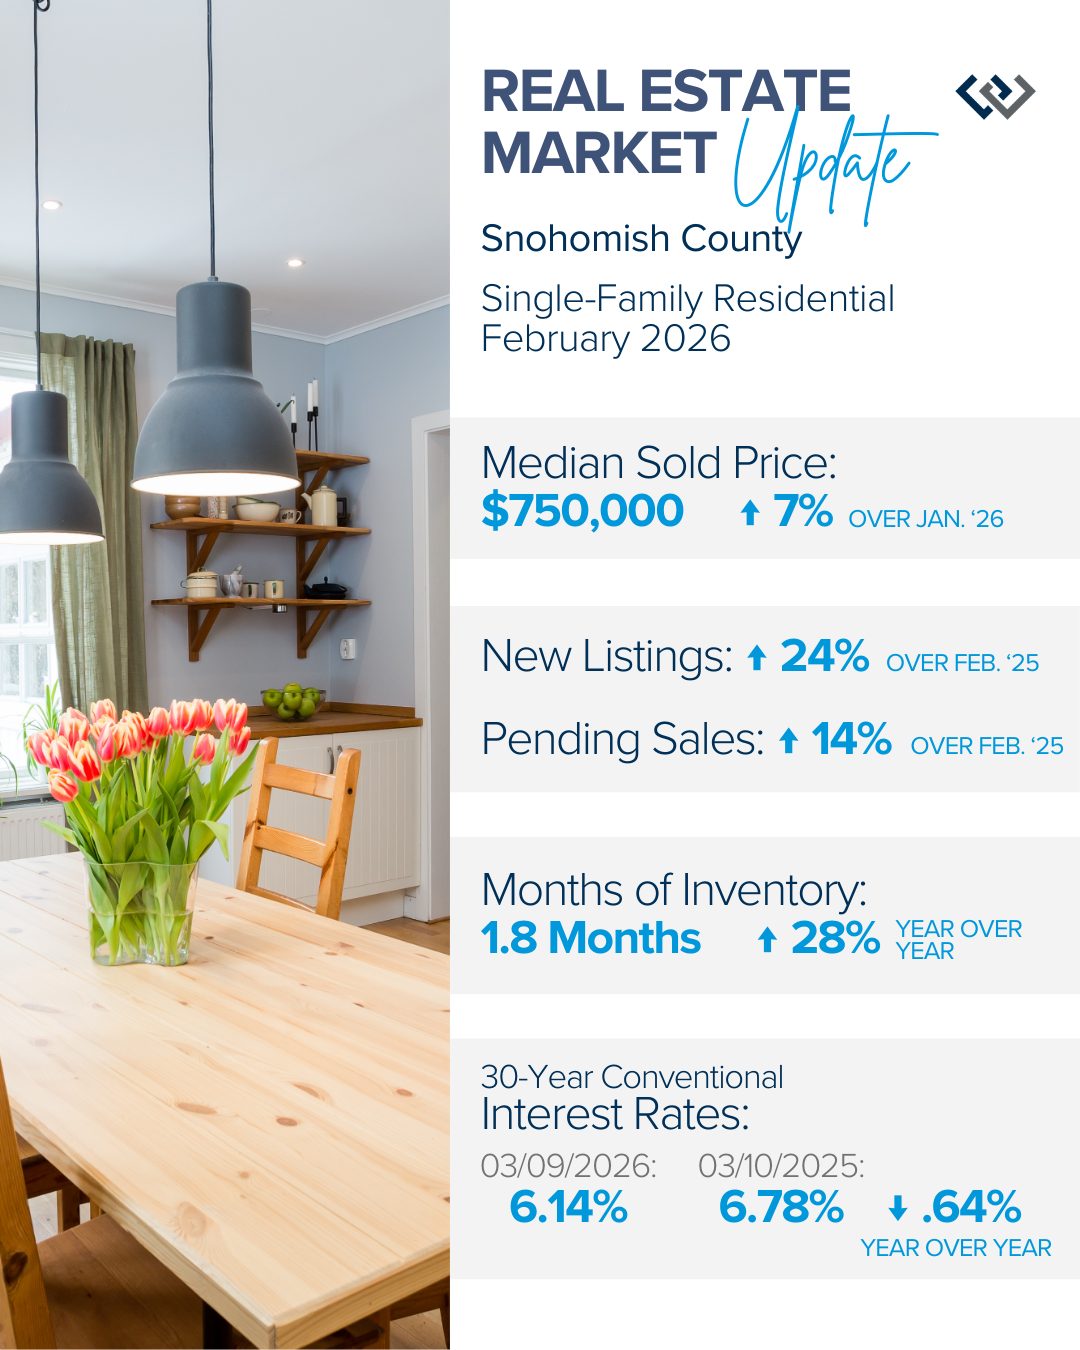
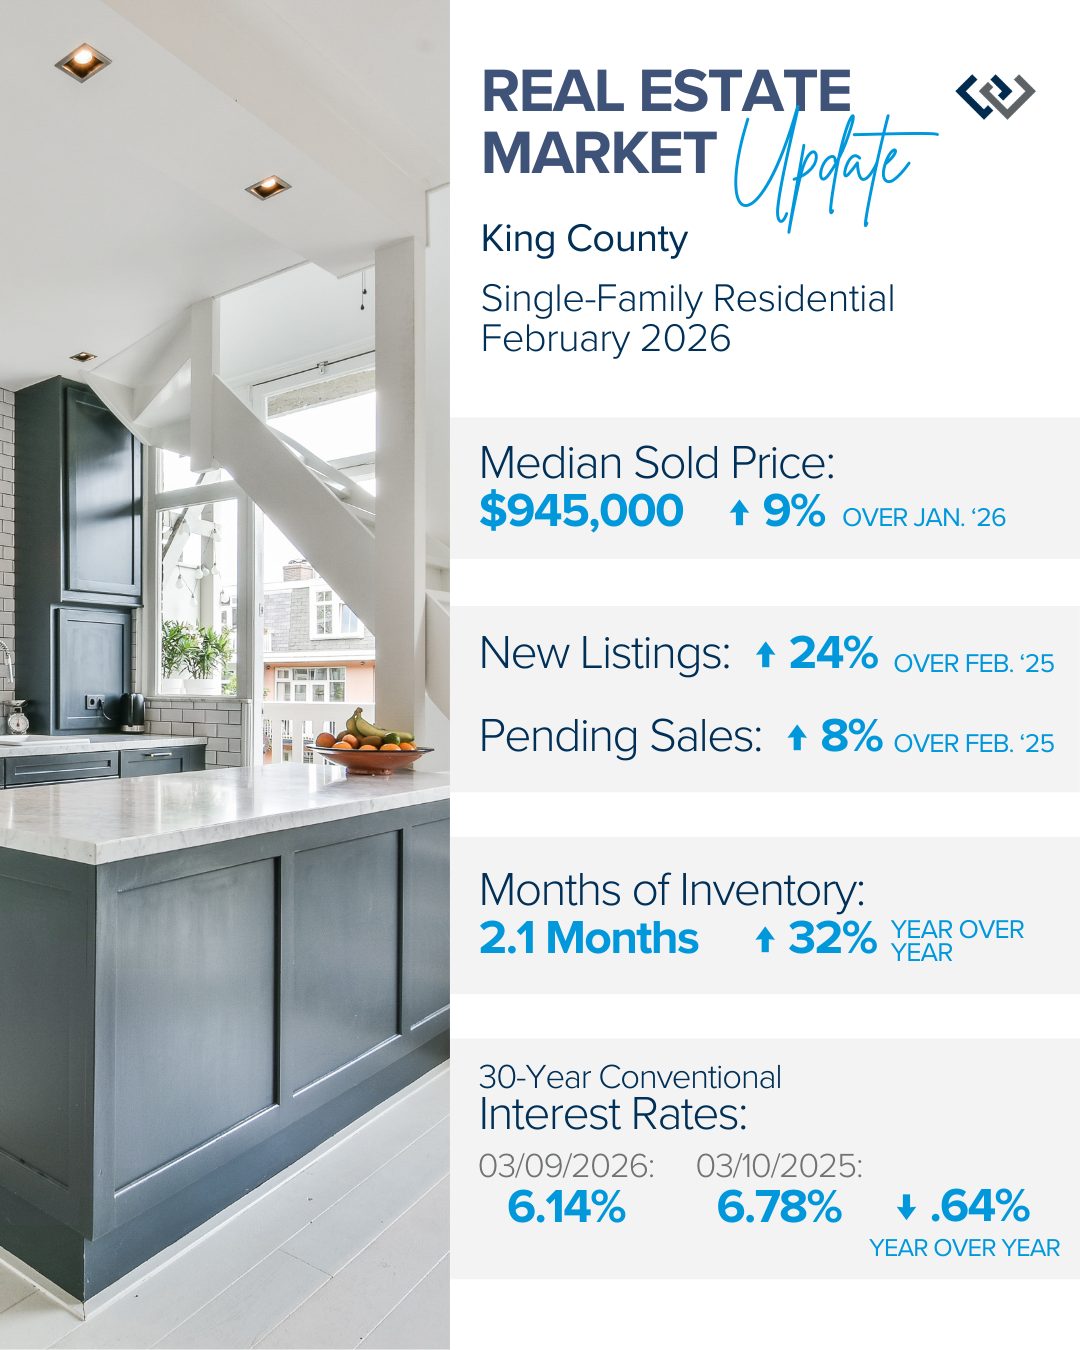
We are starting to see the normal, seasonal uptick in new listings as winter starts to thaw and the trees start to bud. The good news about this uptick in new inventory is it is up year-over-year, illustrating that more sellers are coming to market. Inventory has been pressured since the rise in interest rates, which started in 2022 and hit their peak in October 2023 at 7.91%. Since then, rates have slowly receded and are now hovering around 6%, which has helped with inventory growth and affordability.
Pending sales in February were also up, showing that buyer demand is absorbing the increase in selection. I’m also happy to report that pending sales month-to-date this March are up compared to February, by 42% in King County and 23% in Snohomish County. This mounting activity is a positive sign for the local real estate market.
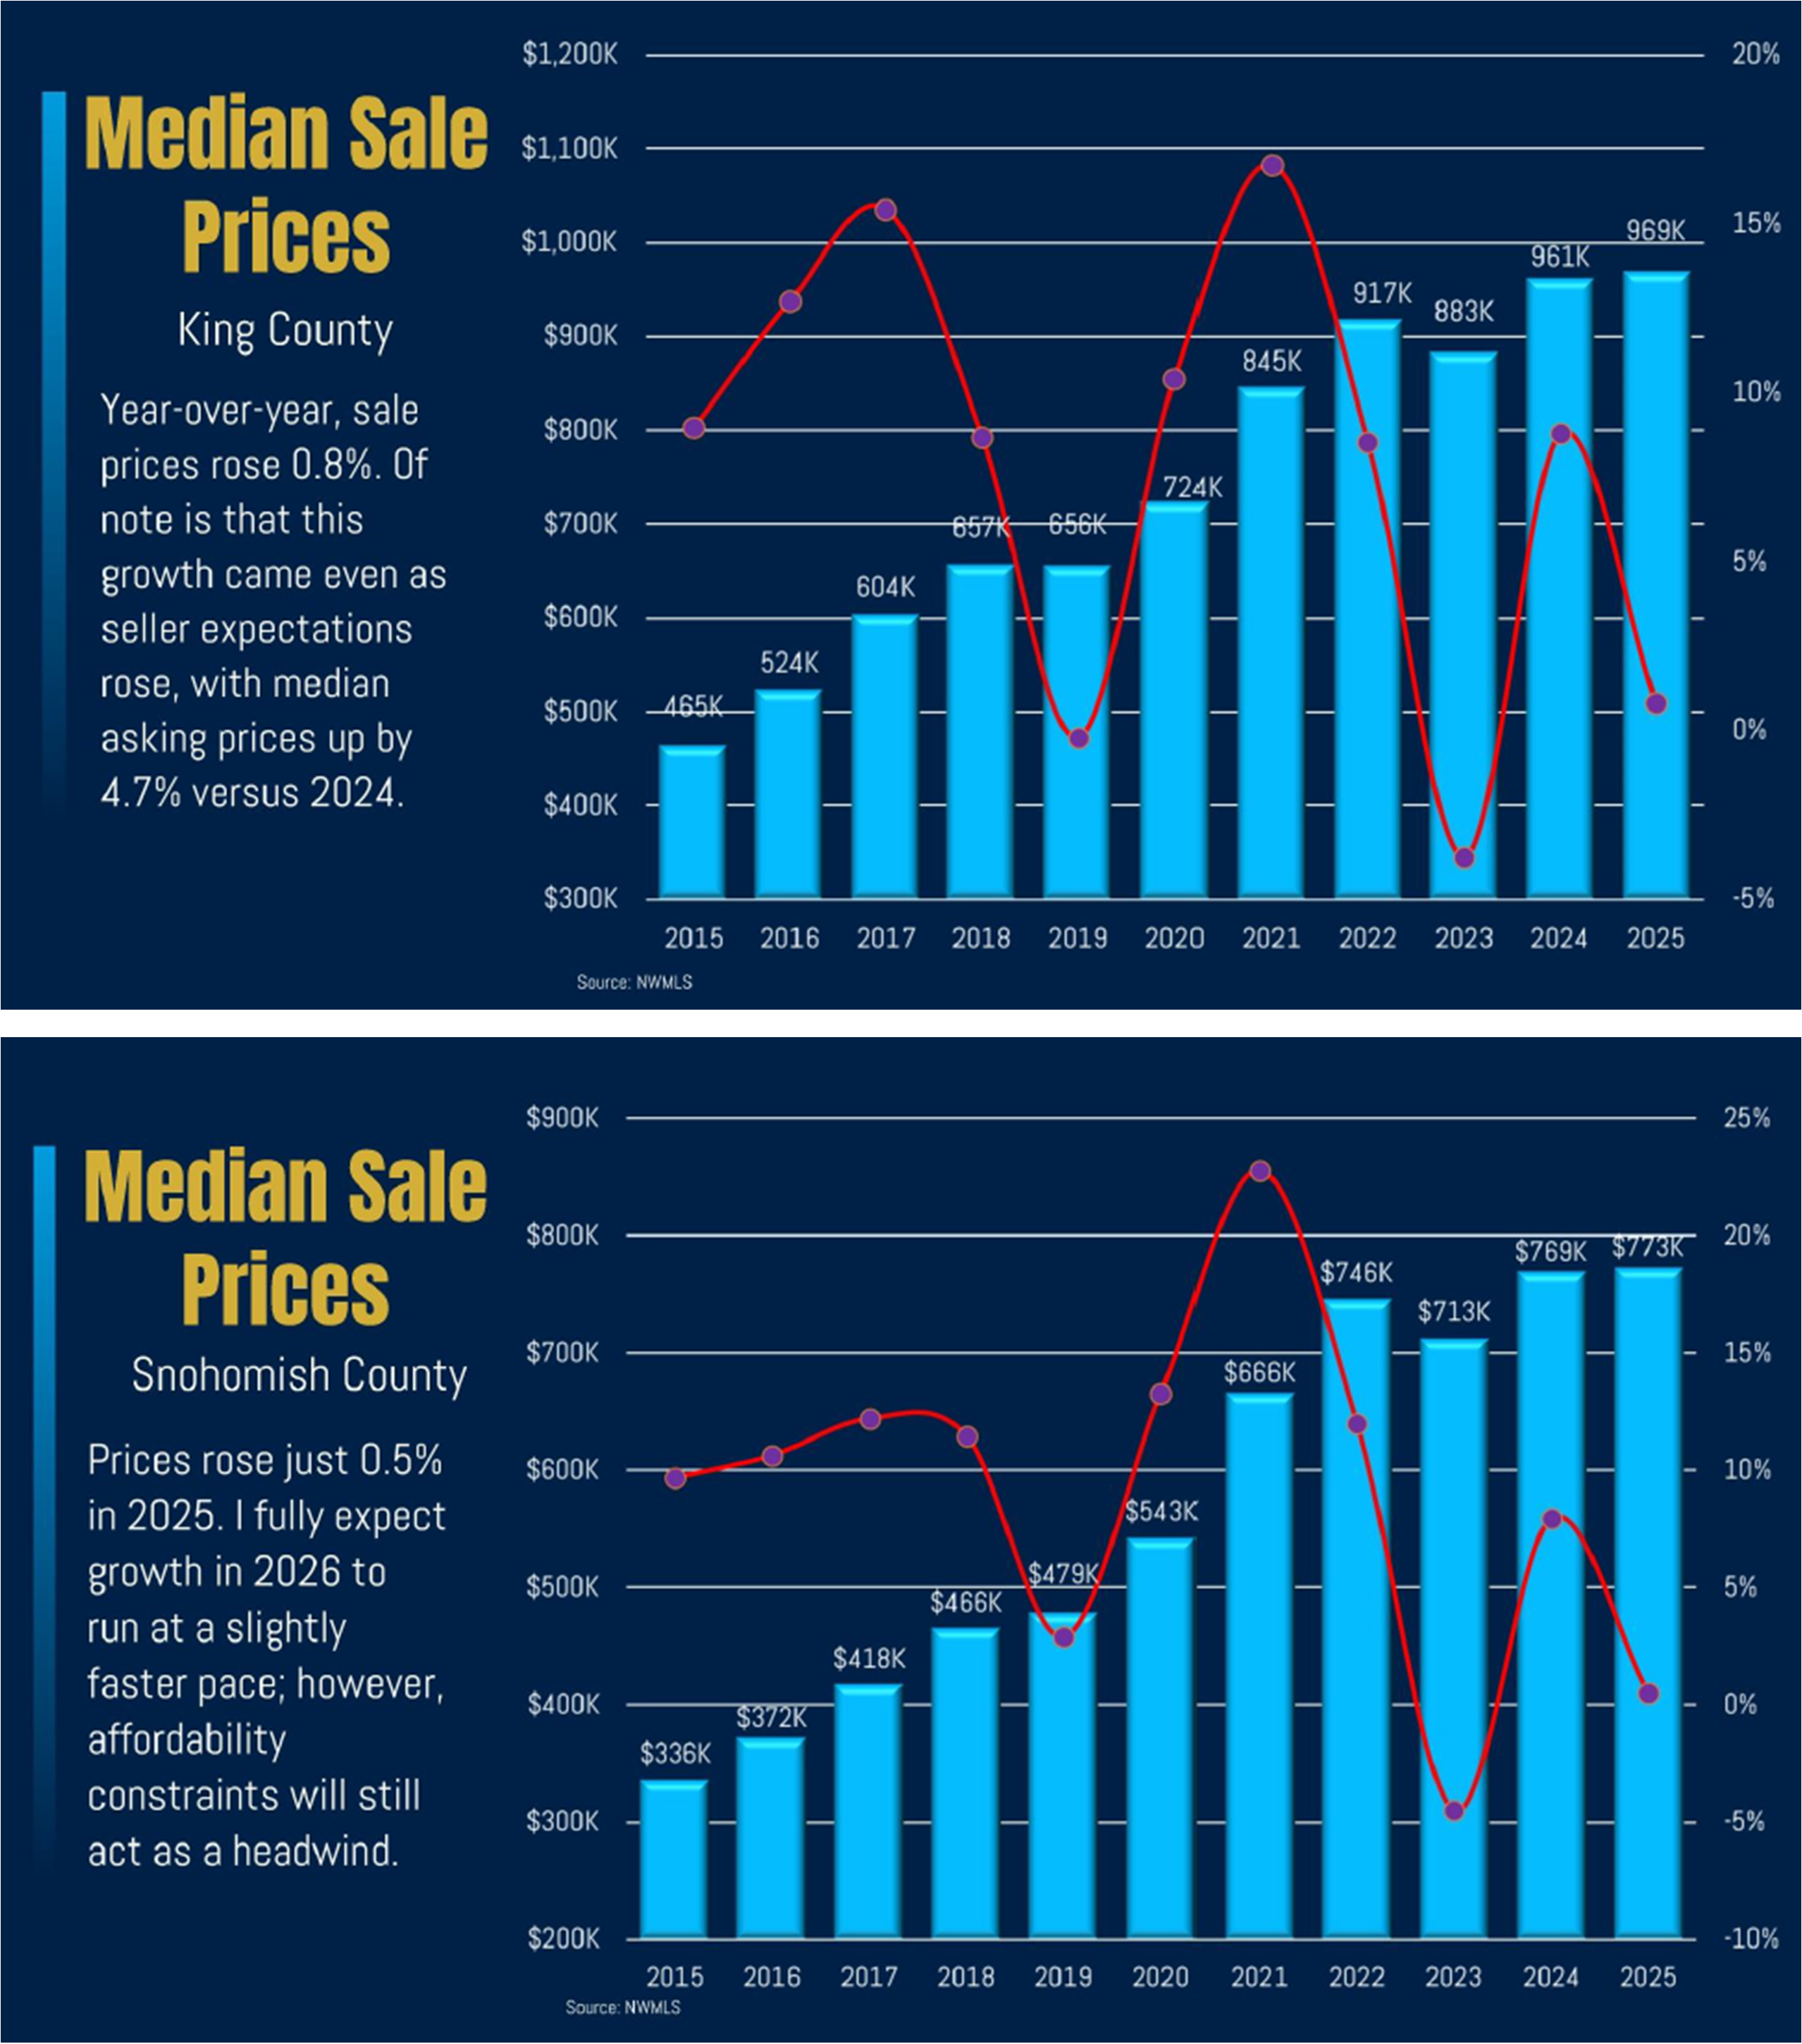
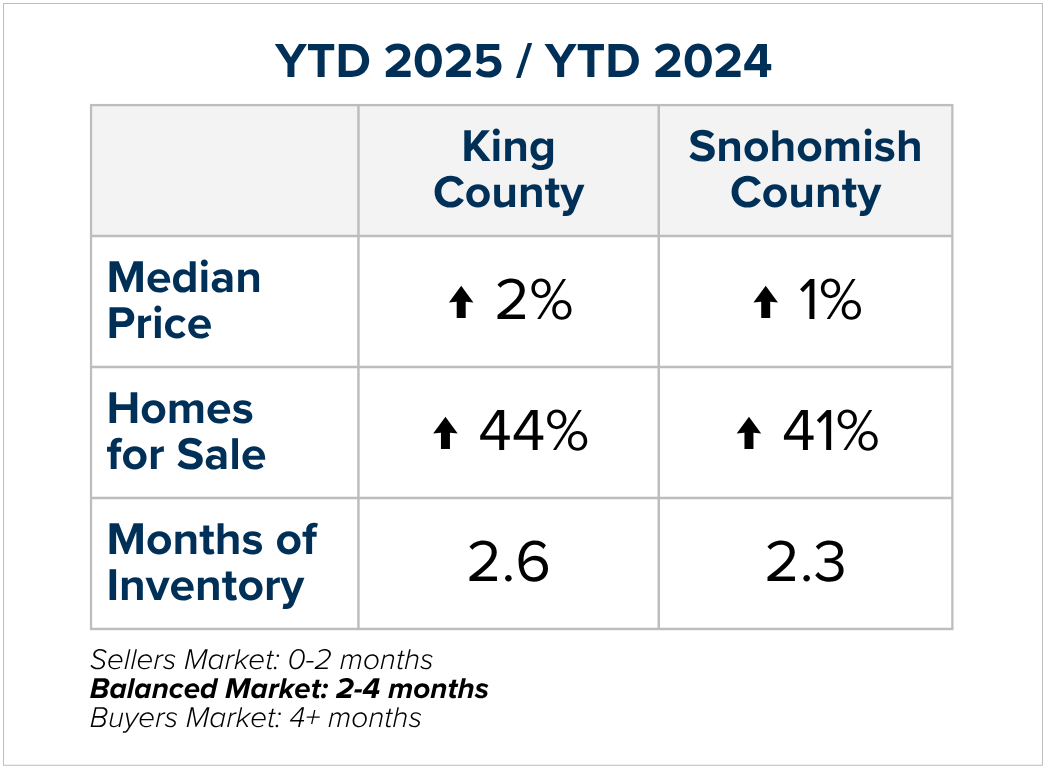
Prices are steady year-over year, down 1% in Snohomish County 12-months over 12-months and up 2% in King County, and are showing signs of seasonal growth month-over-month as we head into spring. Months of inventory is up with the uptick in new listings year-over-year, but teetering from a balanced to a seller’s market, depending on the location, price point, and product. Overall, the market is healthy, fluid, and favoring well-prepared listings that are expertly priced. Buyers are ready to strike for the homes that stand out and are showing their value.
If you are curious about today’s trends and how they relate to your goals, or just love keeping up with the market, I hope you find these facts and figures helpful. If you would like to discuss them further, please reach out. It is always my goal to help keep my client well-informed to empower strong decisions.
What You Need to Know NOW: Real Time Trends for 2026 So Far

A New Year always brings new energy to the real estate market, and 2026 is already starting to show signs of growth, more movement, and a return to normalcy. After three years of slower sales due to higher interest rates, homeowners not wanting to give up their historically low interest rates, and prices remaining stable, 2026 is starting to produce some positive results in the Greater Seattle area real estate market. Some key factors that I have been tracking since the calendar flipped to 2026 that show predictive trends are the rate of:
- New Listings
- Pending Sales (Real-Time Accepted Contracts)
- Cumulative Days on Market (CDOM)
- Sales Prices to Original List Price Ratios
- Months of Inventory (Is it a Seller’s, Balanced or Buyer’s Market?)
- Interest Rates
- Price Trajectory
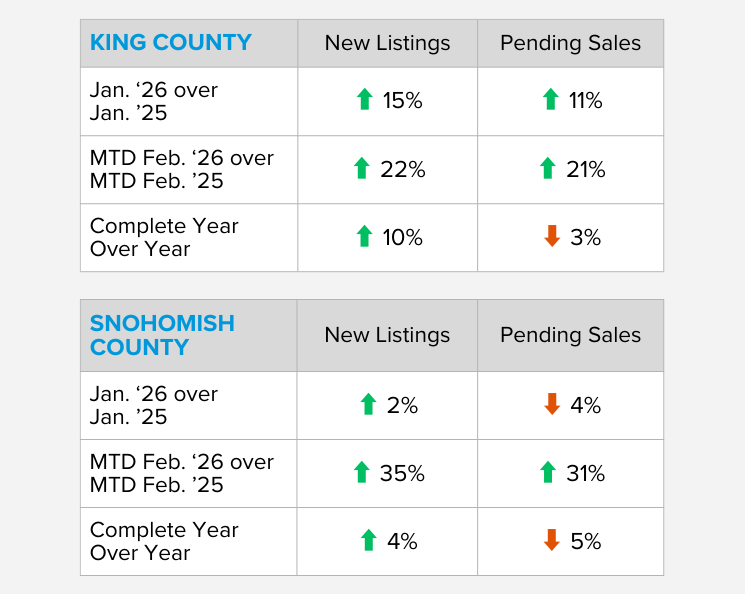
One of the challenges we have faced over the last three years is a lack of inventory, with many would-be home sellers staying in their homes longer in order to hold onto their low rate and payment. This has led people to stay in homes that are not the best fit for their lifestyle, and this pent-up seller demand has started to break loose. As you can see from the chart above, New Listings are up in both King and Snohomish Counties year-over-year, especially this February. This shows that for some sellers, the time has come to focus on the right fit versus payment.
Additionally, another encouraging sign is an uptick in Pending Sales (Real-Time Accepted Contracts) year-over-year and most recently during the first two weeks of February compared to the same time last year. This illustrates that buyer demand is meeting the increase in new listings and that there is a ready and willing audience wanting more selection to choose from. When the increase in pending sales starts to pace and even outpace the rate of new listings, we know there is solid demand.
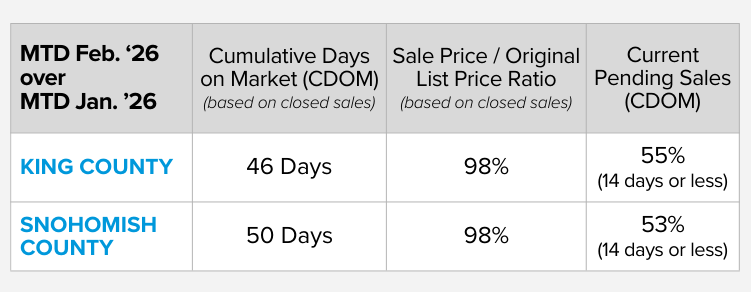
The most current data above for both King and Snohomish counties shows the Cumulative Days on Market (CDOM) for the current pending sales that were accepted since January 1, 2026; more than half quickly came off the market in two weeks or less! This is a stark difference from the CDOM for closed sales in January 2026, which most likely went pending (contract accepted) in late Q4 2025. The market is waking up to the New Year with vigor and excitement for well-prepared, appropriately priced homes.
The sales price to original list price ratios are also starting to improve, inching up to 98% in the first two weeks in February 2026 from 96% in January 2026. Home sellers that are aligning with a trusted advisor to help them prepare their home for market and stay close to the data for pricing are starting to see quicker, full-price sales, and in some cases, multiple offers with price escalations. It is important to note that property condition, cleanliness, expert staging and marketing, and realistic pricing all play a critical role in garnering optimal results.
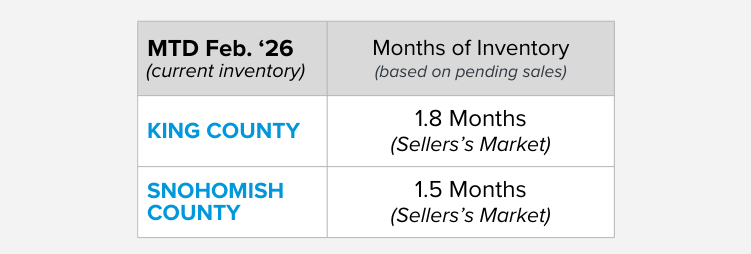
This finds us currently (MTD February 2026) in a Seller’s Market based on pending sales (0-2 Months of Inventory) in both King and Snohomish counties after only being 45 days into 2026. We calculate Months of Inventory by dividing the number of pending sales by the number of available homes for sale to determine how quickly we’d run out of inventory if no new homes came to market based on pending sales demand. We have not been at this level since April 2025 and spent the remainder of 2025 in a balanced market, so this is a marked improvement.
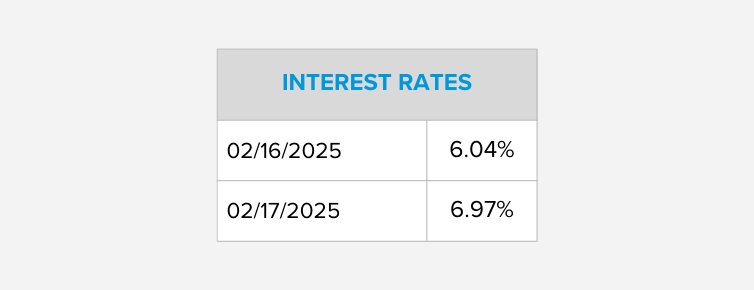
Interest rates are almost an entire point lower than they were last year at this time, which affords a buyer 10% more in buying power or simply results in a lower payment at the same sales price. You can view the video from Jeff Tucker, Windermere’s Chief Economist, below on what has caused interest rates to decrease. Rates declining closer to 6% and teetering towards the high 5% will unleash more demand in the market as it makes homes more affordable, and with prices maintaining, the rate matters! I think this has also led more potential home sellers to come to market as the current rates are more palatable than when they were 1-2 points higher over the last three years.
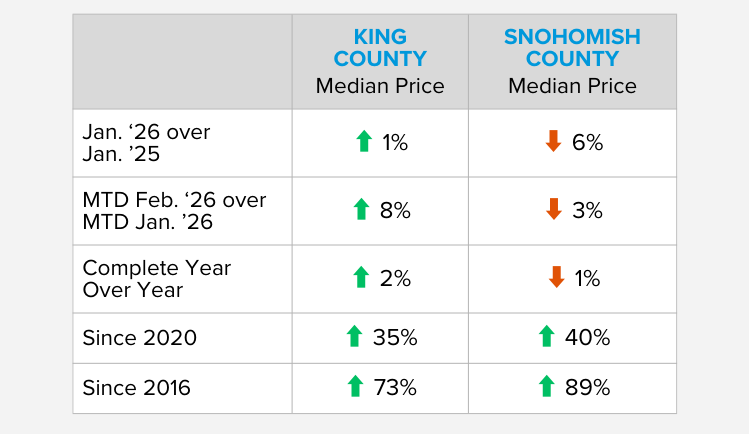
This brings us to price trajectory. With eight months of 2025 being a balanced market, rates hovering in the 7% throughout last year, and many of the homes that closed in January 2026 going under contract in late 2025, January prices recorded at lower price levels. When you take the median price over the last 12 months and compare it to the previous 12 months (complete year-over-year), prices are flat and stable.
With early indicators such as pending sales, lower rates, and faster CDOM, I anticipate more historical price growth levels in 2026, between 3-5%. I certainly do not anticipate prices lowering. In fact, we have seen list prices soften, and more home sellers who are truly motivated come to market with realistic expectations and better market preparation. The new normal is taking shape.
This uptick in market activity and return to normalcy comes on the shoulders of extreme home equity growth since 2020 and over the last 10 years. The growth is staggering! The abundance of wealth that people have in their homes is beneficial to positioning a move that better fits their lifestyle, funding a remodel, helps plan for retirement, or even an out-of-state move as long at the payment works. The recent decrease in rate and long-term equity gains have supported these exciting moves.
If you or someone you know are curious about how the latest trends, long-term growth in the market, and current rates affect your ability to make a move, please reach out. I am committed to staying close to the real-time data, assisting with discerning the information, and applying it to my clients’ goals to help them navigate big life changes. It is my mission to help keep my clients informed, so they are empowered to make strong decisions. 2026 is already starting to provide some great opportunities, and if you’d like to learn more, let’s talk!
Top Takeaways from Matthew Gardner’s Economic Forecast Event

Last week, my office had the pleasure of hosting esteemed economist Matthew Gardner, who presented his Economic and Housing Market Forecast for 2026. He looked at the national and local (King & Snohomish counties) economies and housing markets and shared his insights. This included a look back at 2025 and a gathering of facts, trends, and indicators that will set the stage for influencing financial decisions in 2026, specifically surrounding housing.
US Economy
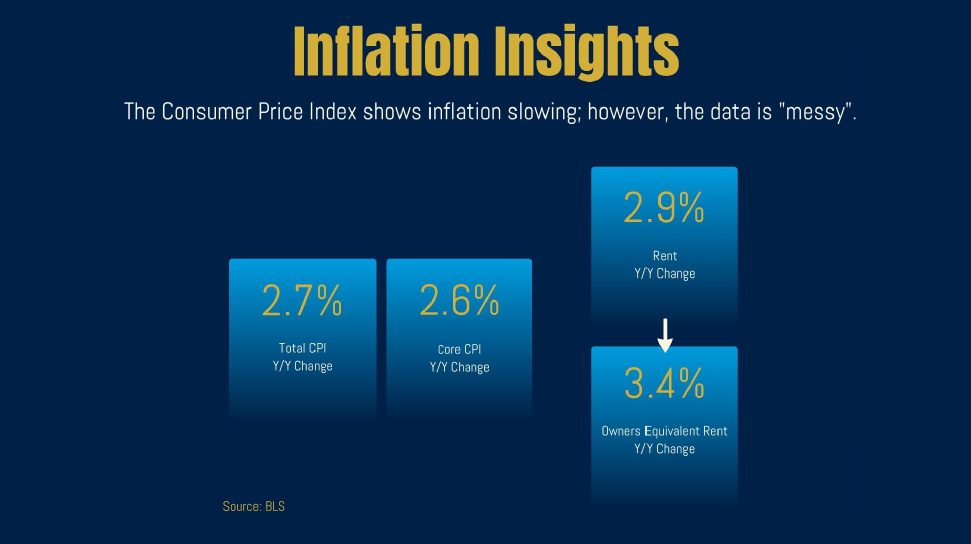
The combination of consumer confidence and consumer sentiment, inflation, and consumer spending gives us a good picture of where our economy is and where it is heading. Consumer confidence is a bit lower due to uncertainty surrounding the effect of tariffs, immigration, interest rates, and affordability. However, consumer sentiment has improved, and we are still seeing an increase in spending. Inflation has tempered from post-pandemic highs and has settled at 2.6% year-over-year for core inflation, which excludes food and energy. When you add that back in, it is up 2.7%. This is a vast improvement from the 6-9% rates we were seeing coming out of the pandemic years.
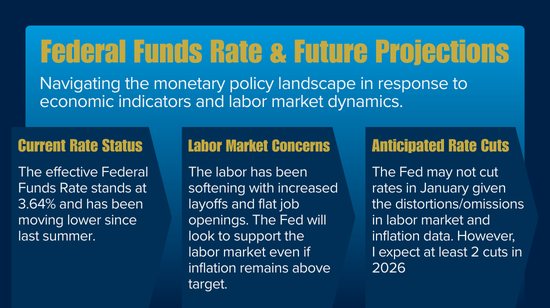
This has caused the Fed to continue to lower the Federal Funds Rate (short-term), which currently sits at 3.64%, and he anticipates further cuts in the late spring and possibly another later in the year, resulting in a rate closer to 3%. This is due to two conflicting figures: employment rates and inflation rates. Employment rates are slightly down, and inflation is slightly up; lowering the rate is intended to help stimulate spending to support economic growth.
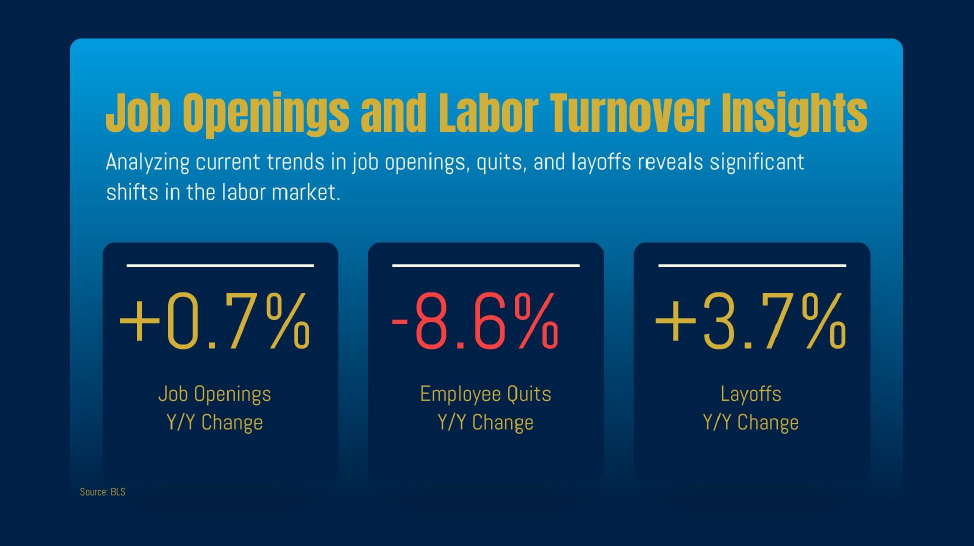
The job market has softened due to employers being more cautious about creating more jobs and instead asking for more productivity out of their current employees. Layoffs slightly increased in 2025, but employee quits have decreased, resulting in a 4.3% unemployment rate and a 1% increase in job openings. The labor force (number of available workers) is not growing due to immigration, yet H2A and H2B visas are filling manual labor and hospitality jobs to keep business effectively running.
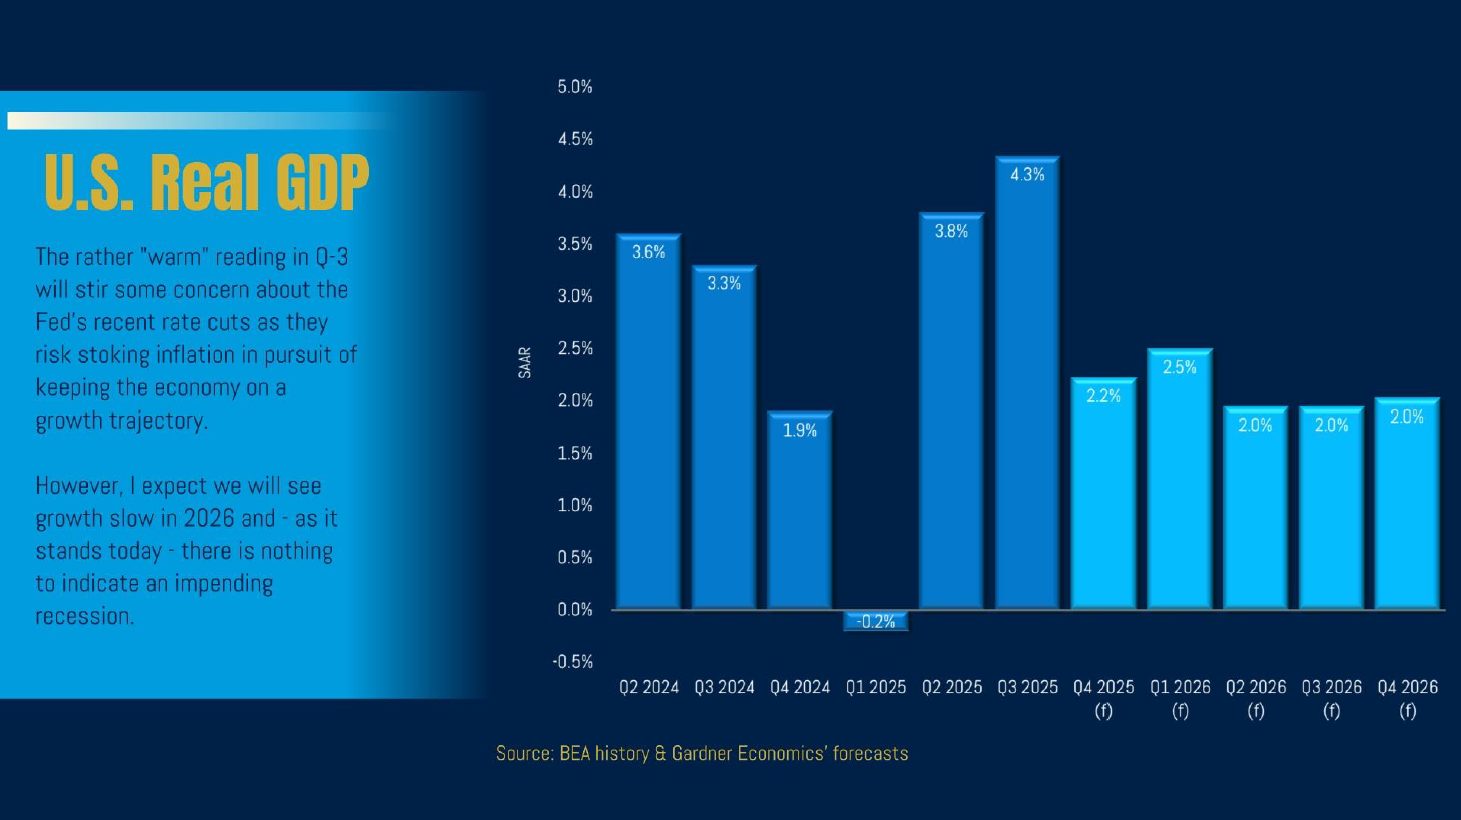
Tax cuts will also be felt in 2026, with more money being left in workers’ hands; whether they will save it or spend it remains to be seen. With all of this said, there is no sign of a recession, which is supported by a 2% increase in Gross Domestic Product (GDP). The definition of a recession is two consecutive quarters of negative GDP growth. We simply have not seen that, nor do we anticipate it, albeit we are overdue for a recession cycle based on historical trends.
Local Economy
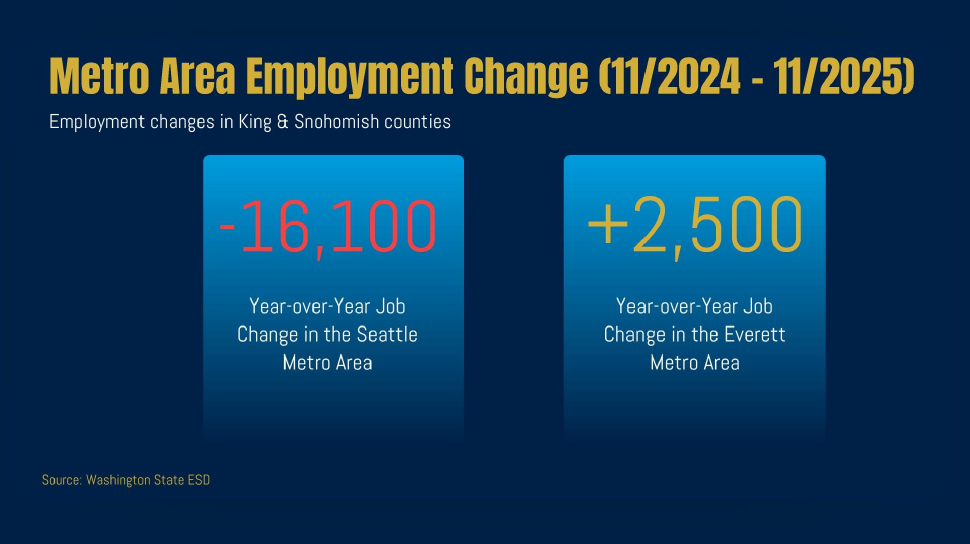
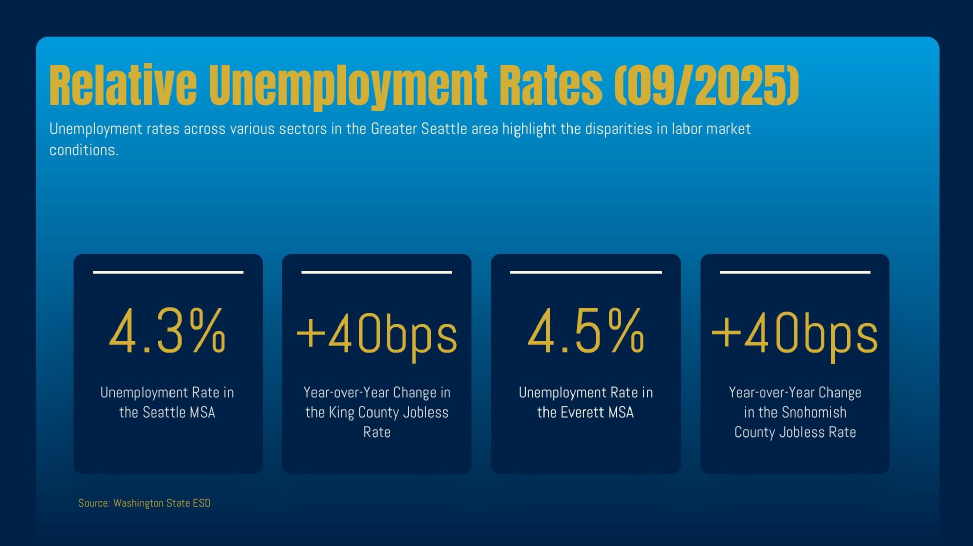
The Greater Seattle employment picture varies from King County to Snohomish County. There were 16,100 fewer jobs in King County in 2025 year-over-year, and a 4.3% unemployment rate. In Snohomish County, there were 2,500 jobs added in 2025 and an unemployment rate of 4.5%. For 2026, he anticipates modest growth with 1% more jobs created in King County and Alaska Airlines’ recent large order at Boeing will stimulate job growth in the area, along with healthcare and education. Meta cut-backs could be counterbalanced by Amazon’s new expansion on the Eastside.
The Greater Seattle area is heavily populated with a smart, talented workforce that is starting to navigate the effects of AI technology replacing jobs. This is more prevalent at the entry-level, and for AI replacement to really take hold will require infrastructure growth on the power grid, which will take many years and a large financial investment. It is certainly something to be paying attention to, and remaining nimble and attractive to employers will be a key factor. Attracting companies to come to or remain in the area is paramount, and tax policy will heavily influence this.
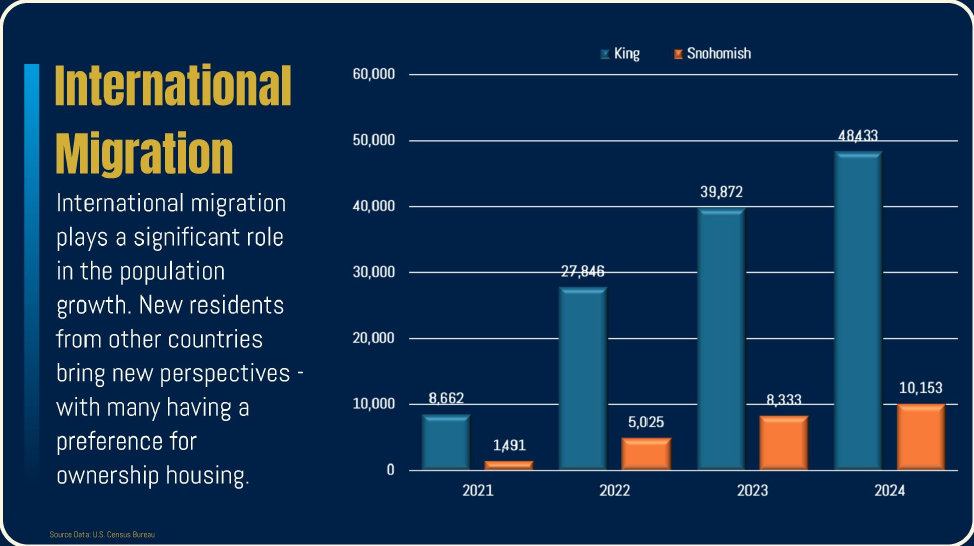
Population growth in our area is tapering in King County and is up slightly in Snohomish County. Birth rates are down, in-state migration is slowing, but international migration remains strong. HB1 work visas create this positive movement, especially in the high-tech job sector.
Interest Rates
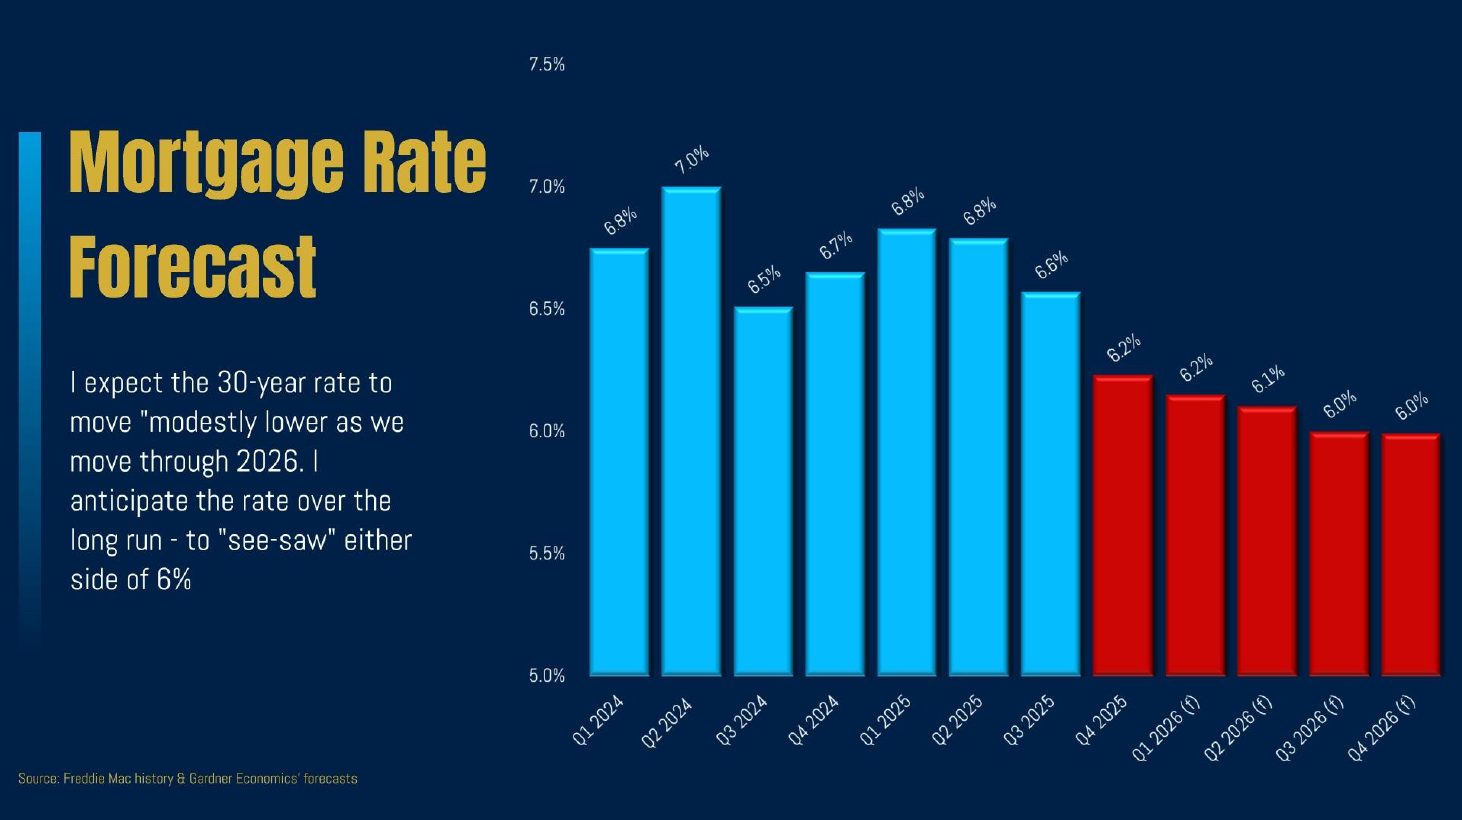
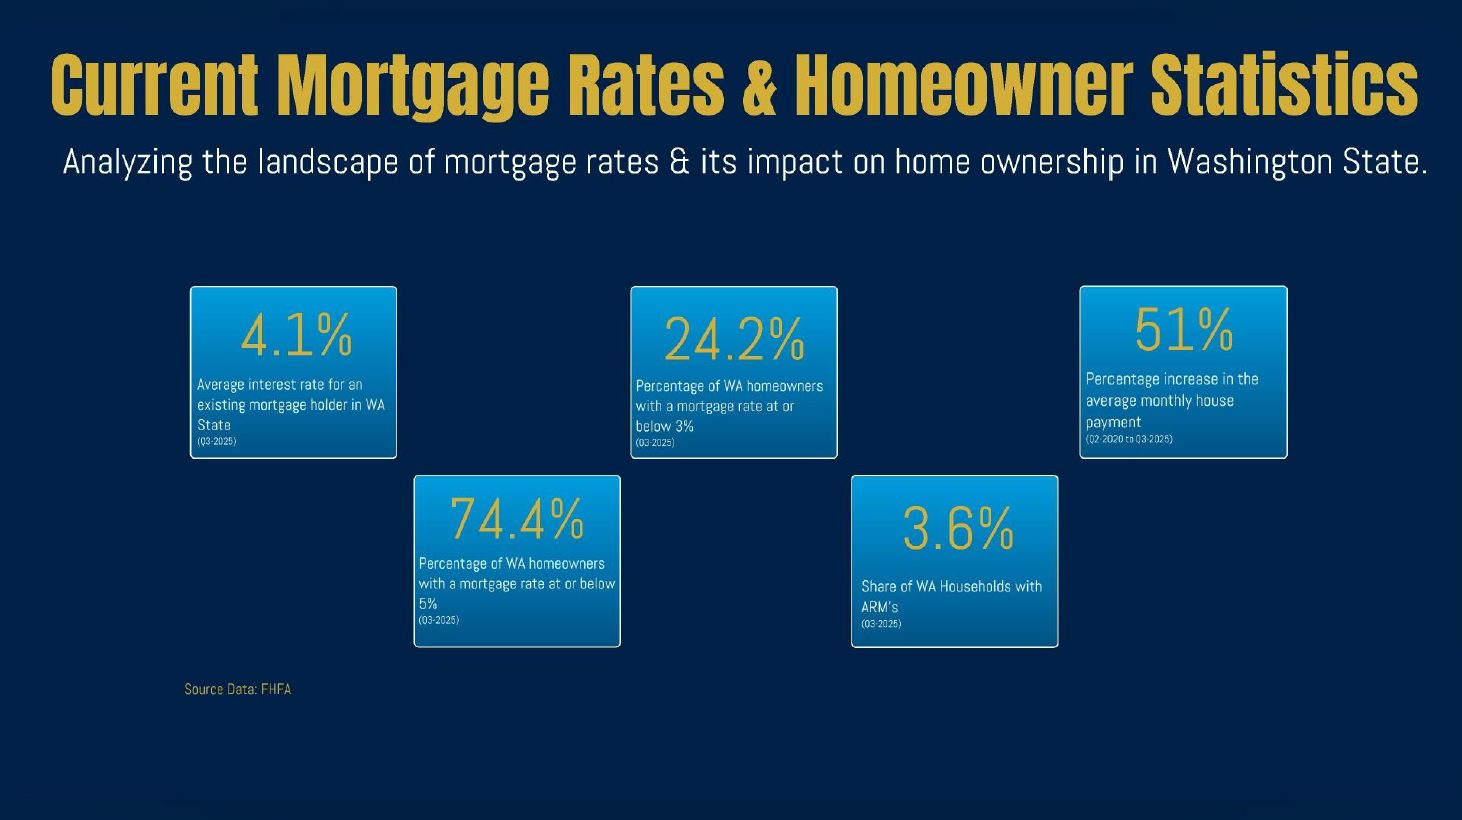
Interest rates are down year-over-year and have hovered in the low 6% range as of late, and he predicts they will gradually recede throughout 2026, outside of any big changes by the administration or increased activity with the bond market. The two factors that rates influence are affordability and the downward pressure they put on inventory.
74% of homeowners in our region have a mortgage rate at or below 5%, and 24% are at or below 3%. This has caused many homeowners who would like to move to stay where they are, as they do not want to give up their lower monthly payment. We call this the “lock-in effect,” which limits selection. This has helped maintain home values and caused prices to remain flat and not fall. However, he sees 2026 as the year that some will rip off the band-aid and choose to align their housing with life changes over the lower payment. If this is coupled with rates lowering, it could be a win-win for buyers and sellers alike.
Local Housing Market
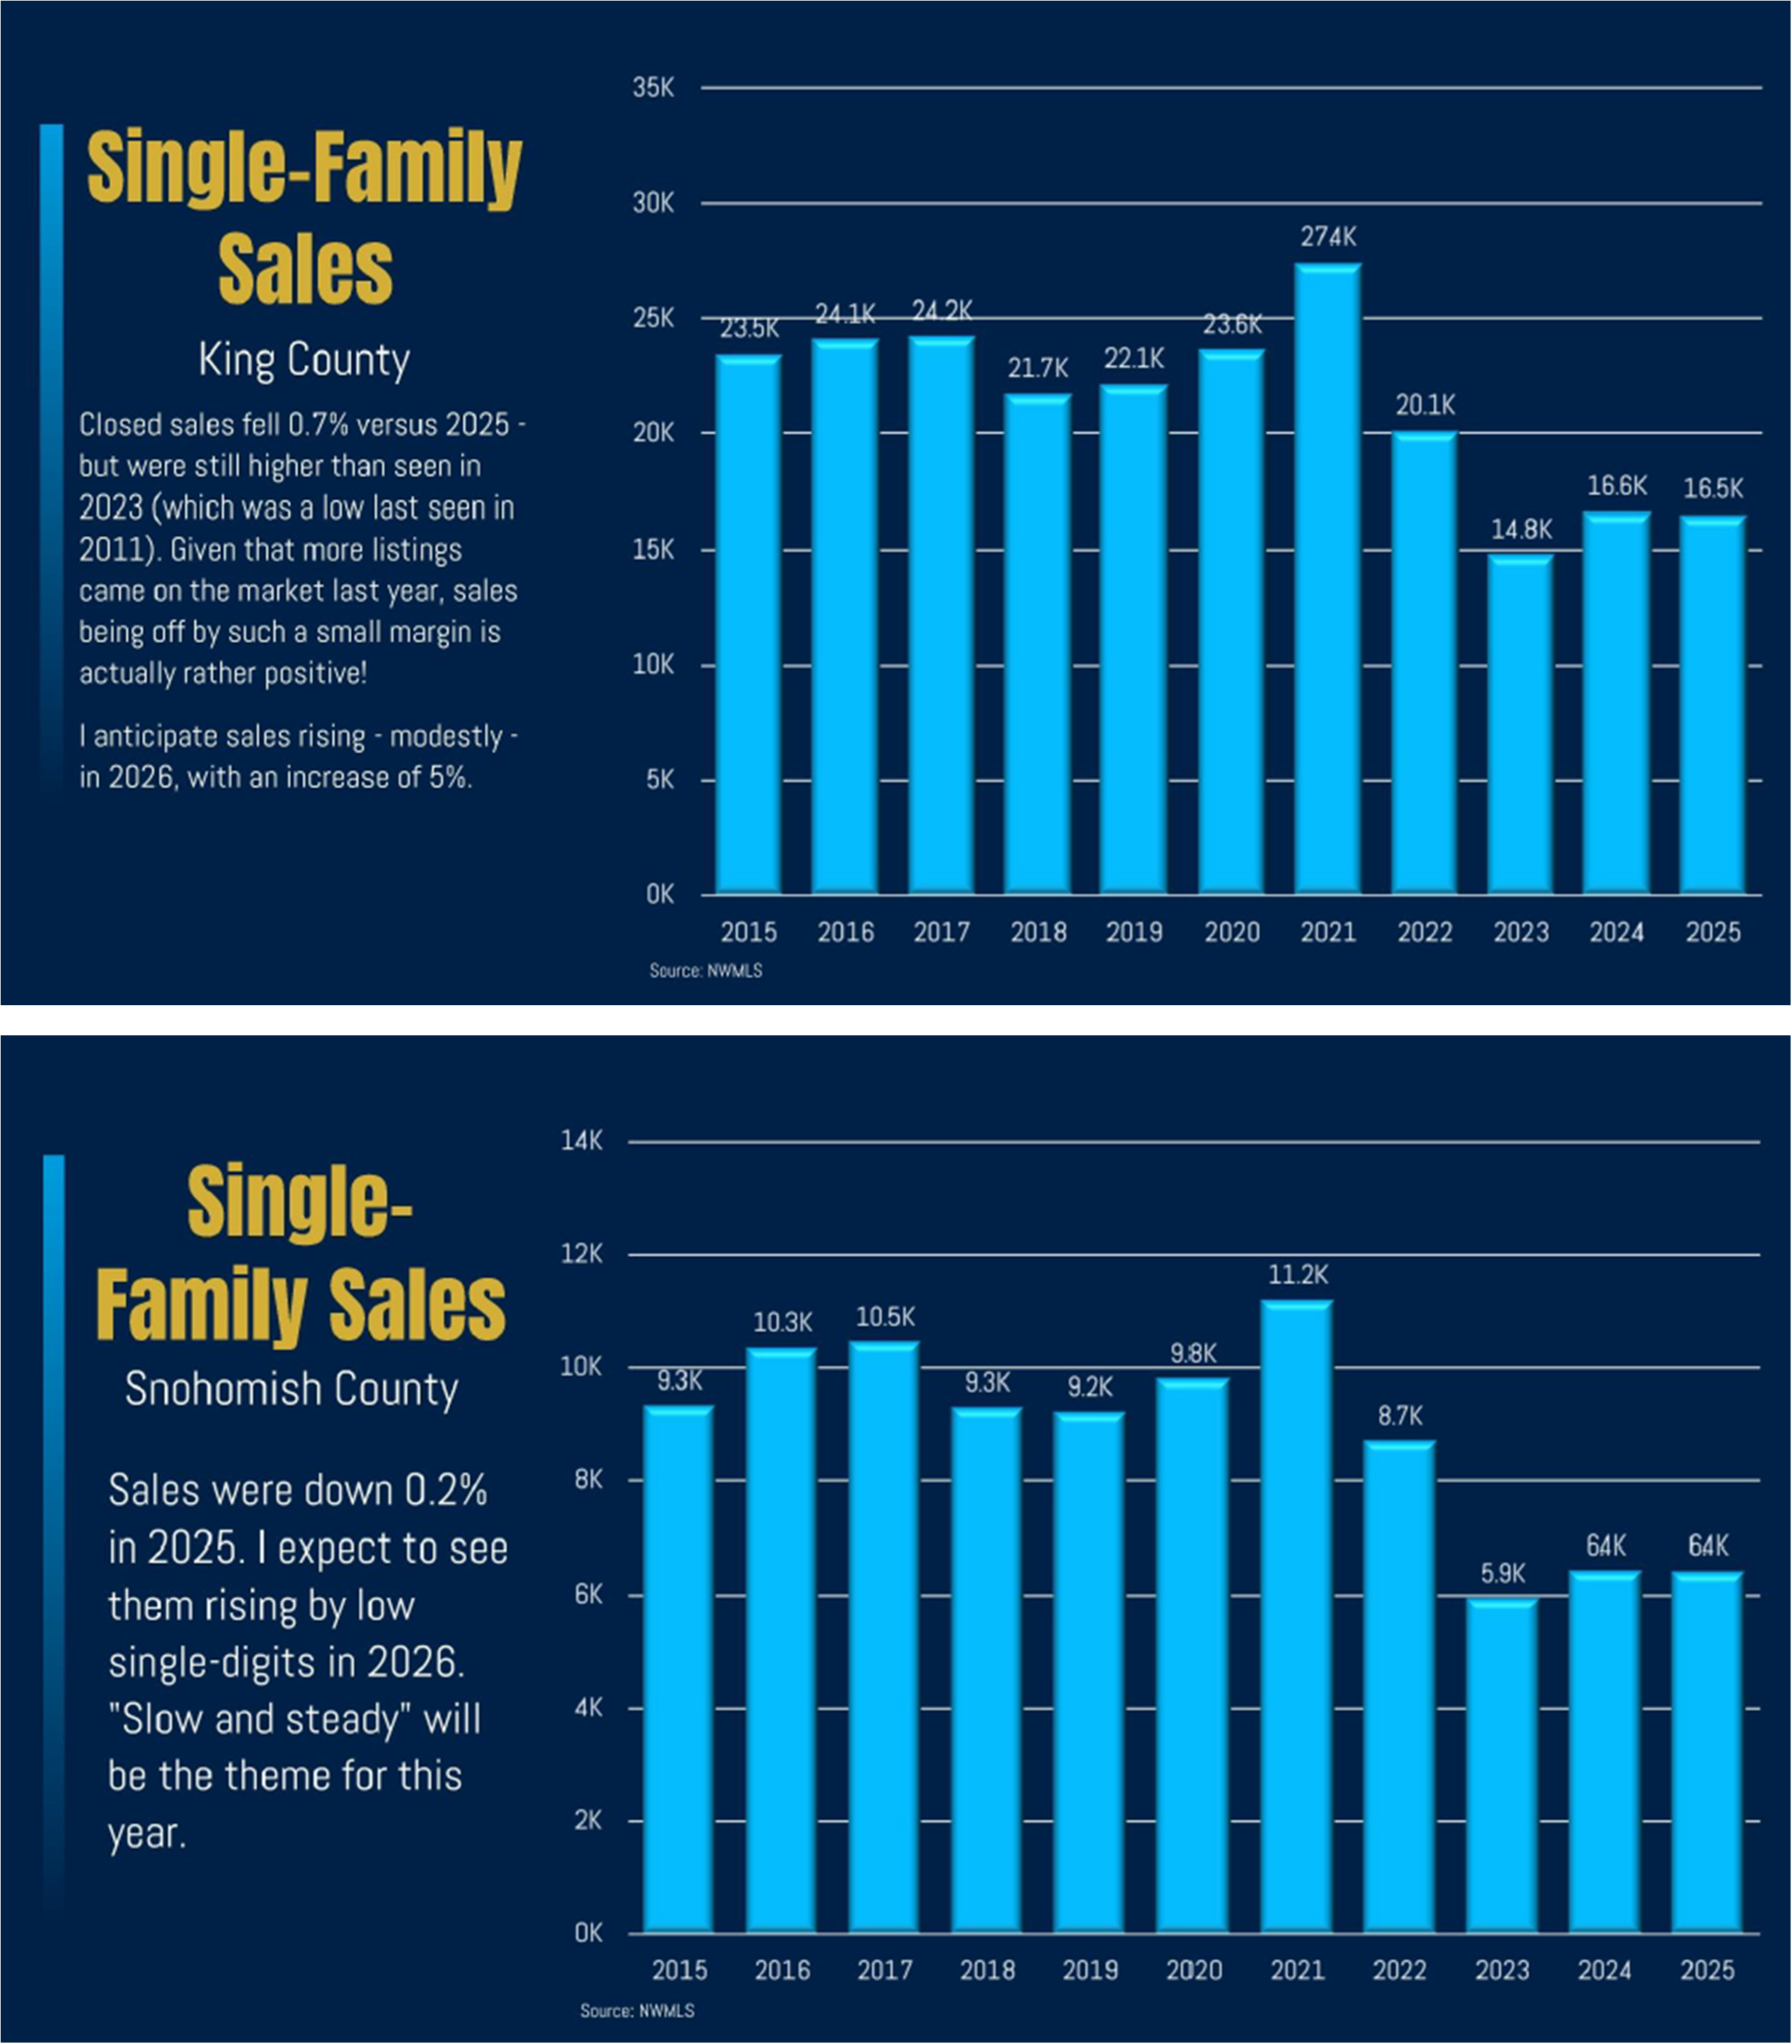
In 2025, King and Snohomish counties saw fewer sales, higher rents, and stable prices. He anticipates a 5% increase in sales due to receding rates and some homeowners moving away from their lower rate to gain the home that best fits their current life needs. After a 120% increase in home prices over the last decade, he predicts prices to grow in 2026 by 2-3% year-over-year. This is below the 35-year historical average of 4-5%, shedding light on perspective after the massive ramp-up in prices during the pandemic.
A highlight of this trend is that many more home sellers are starting to price their homes closer to what the market will bear. It has taken some time for consumers to balance their expectations against the realities of a more normalized market. From the frontlines, we can attest that well-prepared and appropriately priced homes are moving more quickly and are even seeing multiple offers. The nuance, strategy, and staying close to the data matter. And of course, who you hire has become even more important to gain optimal results.
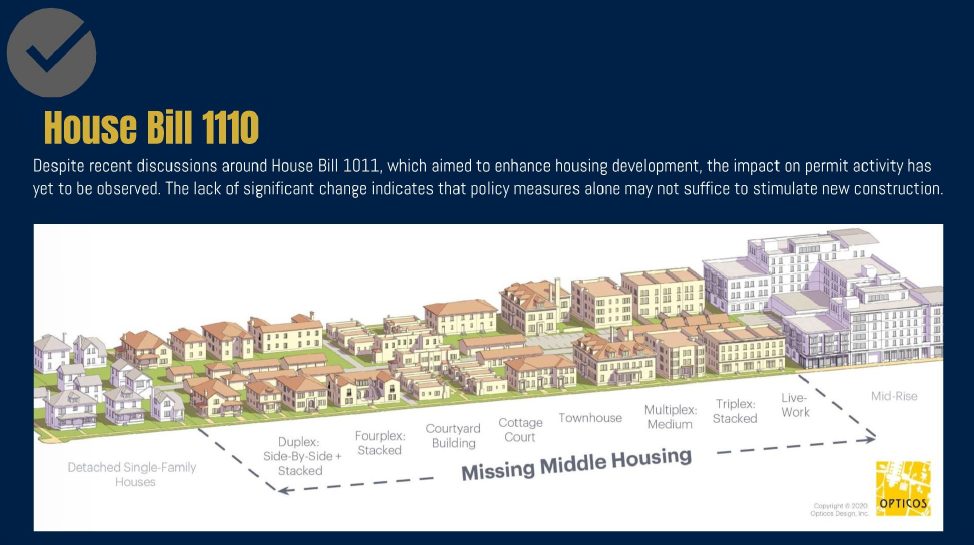
The condo market continues to see higher inventory levels and softening of prices. This is most affected by location, the health of the homeowners’ associations, and monthly dues. However, the number of new condo builds is receding, which will bolster well-managed resale condos. New builds for single-family homes have also been limited due to the WA State Urban Growth Areas (UGA) running out of available land for additional units. It is unlikely that those boundaries will expand anytime soon, which resulted in the middle housing zone changes created by HB 1110. The intent is to create more housing units, higher density, and more affordable housing.
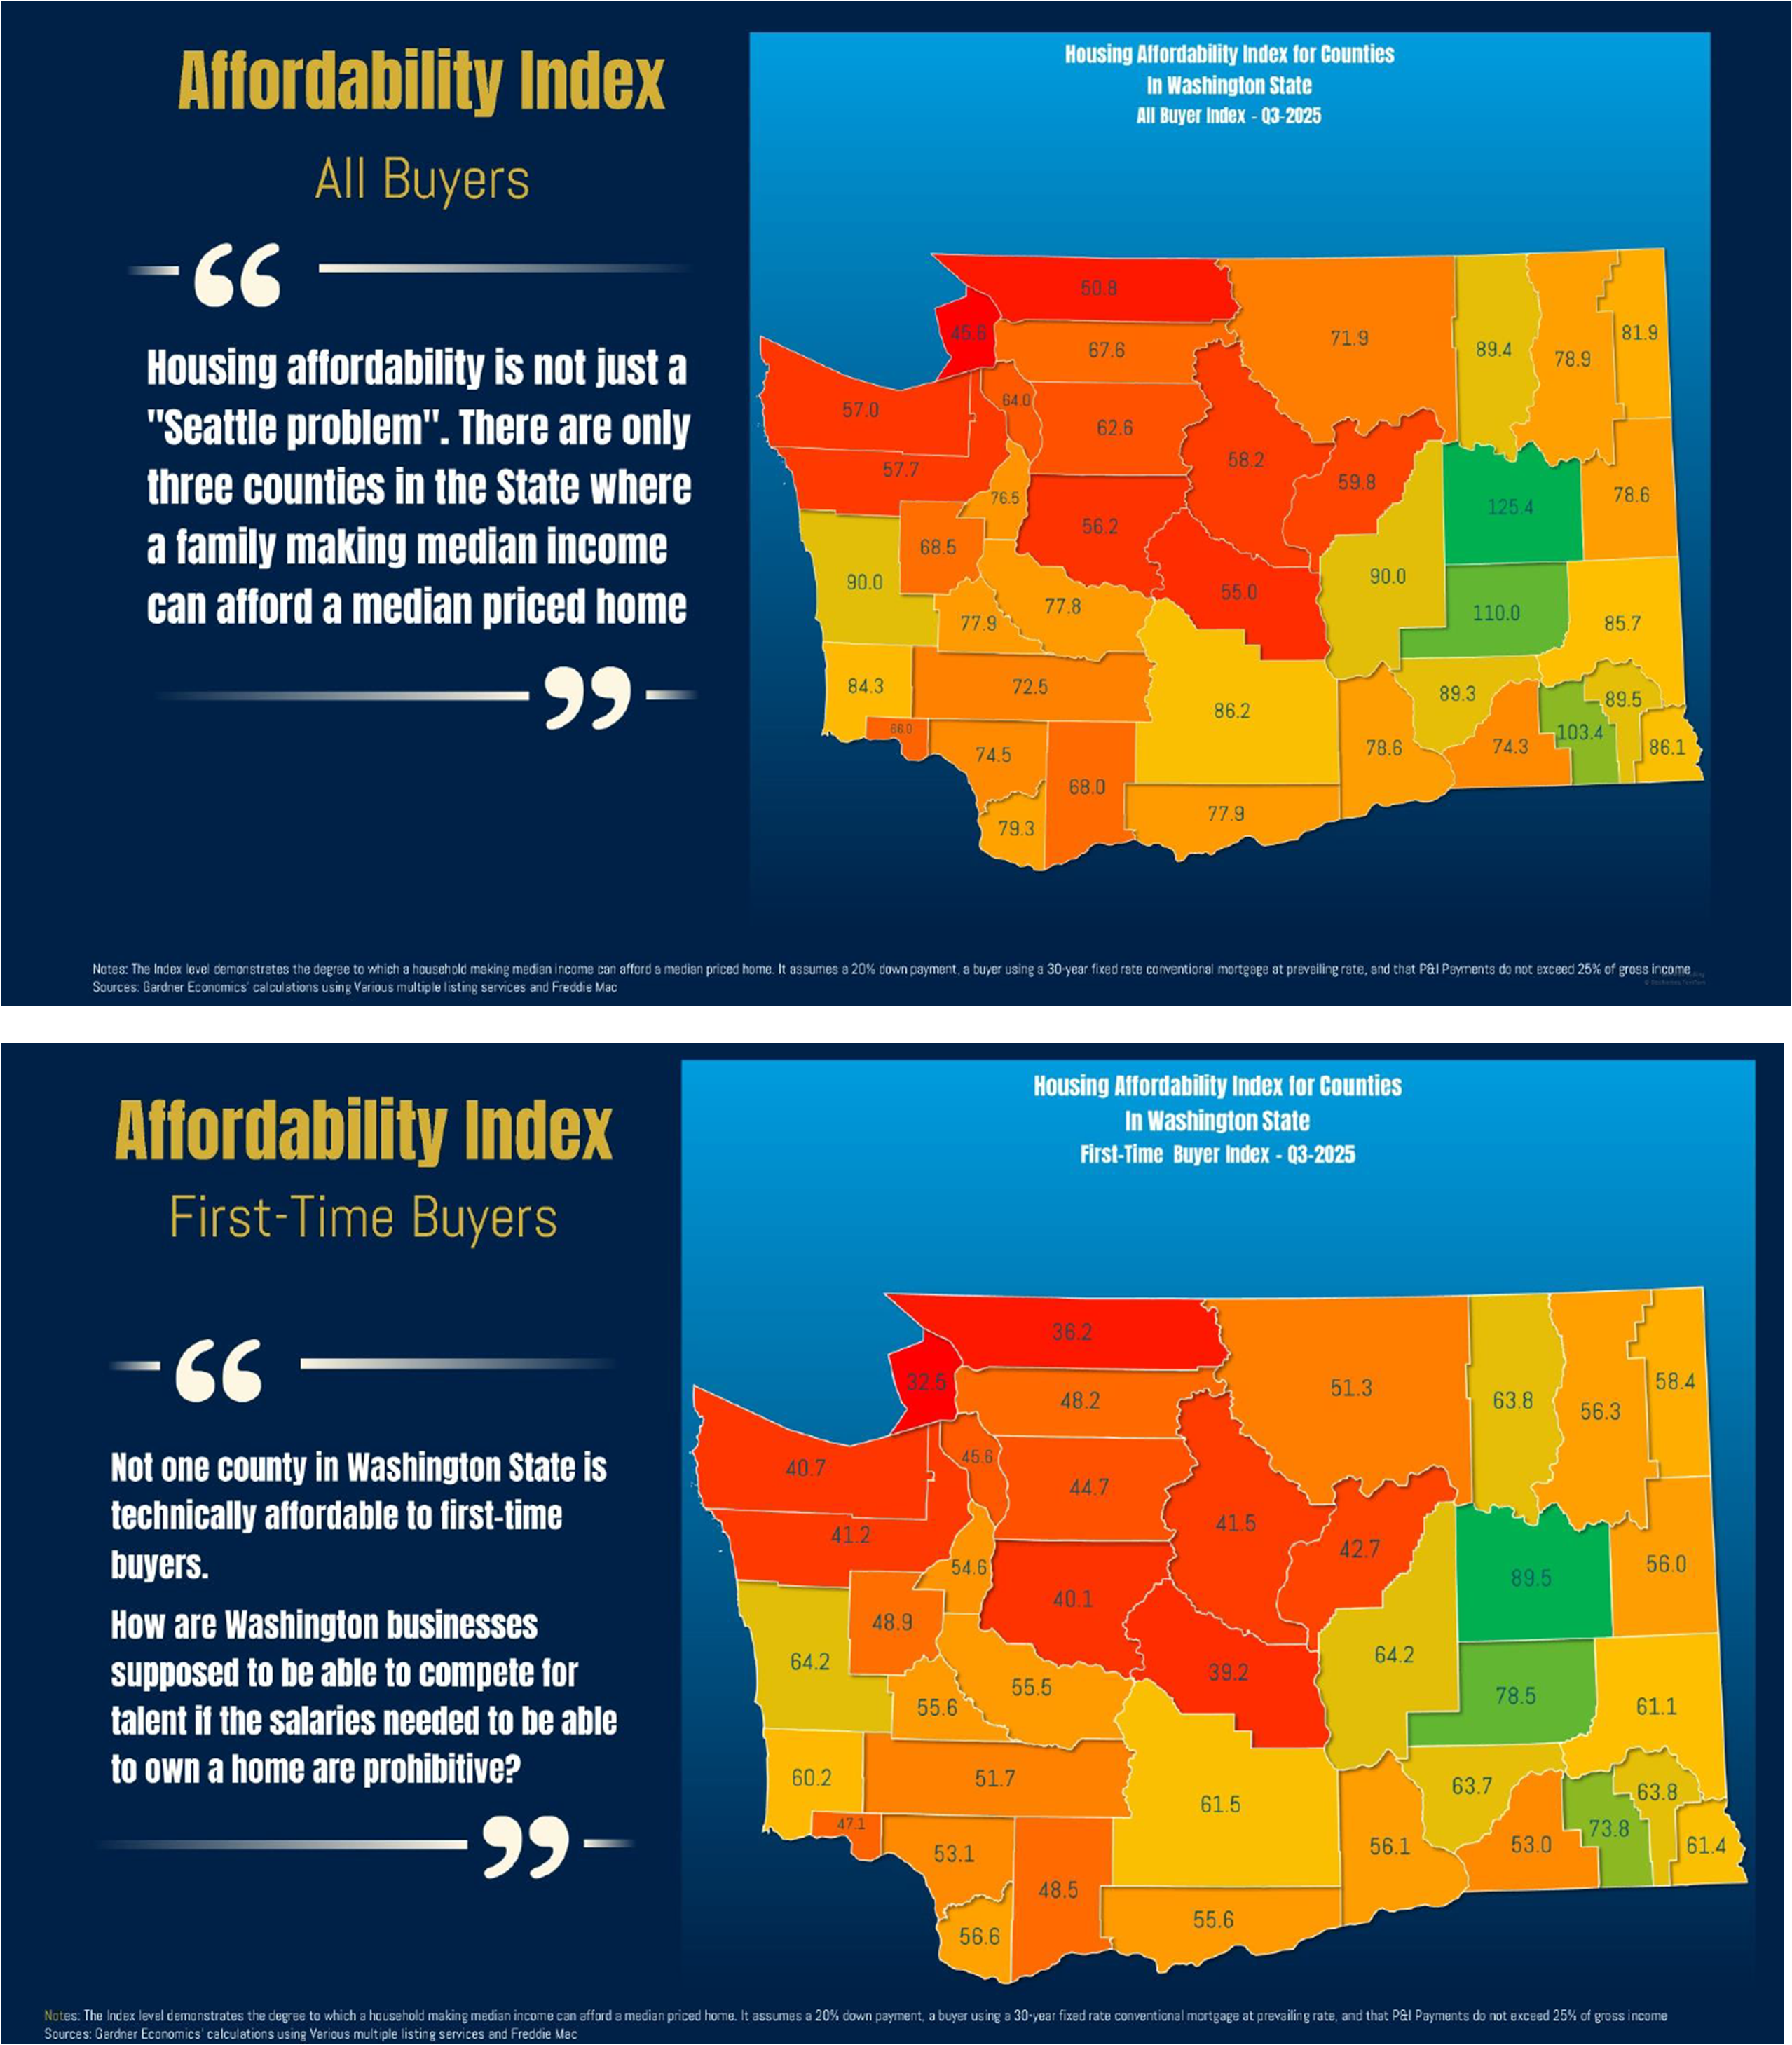
Affordability is our biggest challenge as prices in our area are high, and rates are no longer historically low. It all boils down to the monthly payment and how that is supported by wages. In 2025, the average age of a first-time buyer was 40, illustrating the need to build income and savings. Liquidating stock accounts and generational gifting have been a solution for some buyers in our area. The affordability challenge does not seem to be vastly improving, so jumping on an opportunity to buy with increasing rents and moderate price growth should be paid close attention to. There is no bubble in sight, and rates will slowly fall, so playing with the cards currently available in the deck is key if you can.
If you would like a copy of Matthew’s slides or the link to his presentation, please shoot me an email, and I will get it to you. In the meantime, and throughout 2026, you can count on me to continue to share the latest data, trends, and frontline experiences. It is always my goal to educate and immerse myself in the market to provide my clients with the most up-to-date information to empower them to make strong financial decisions.
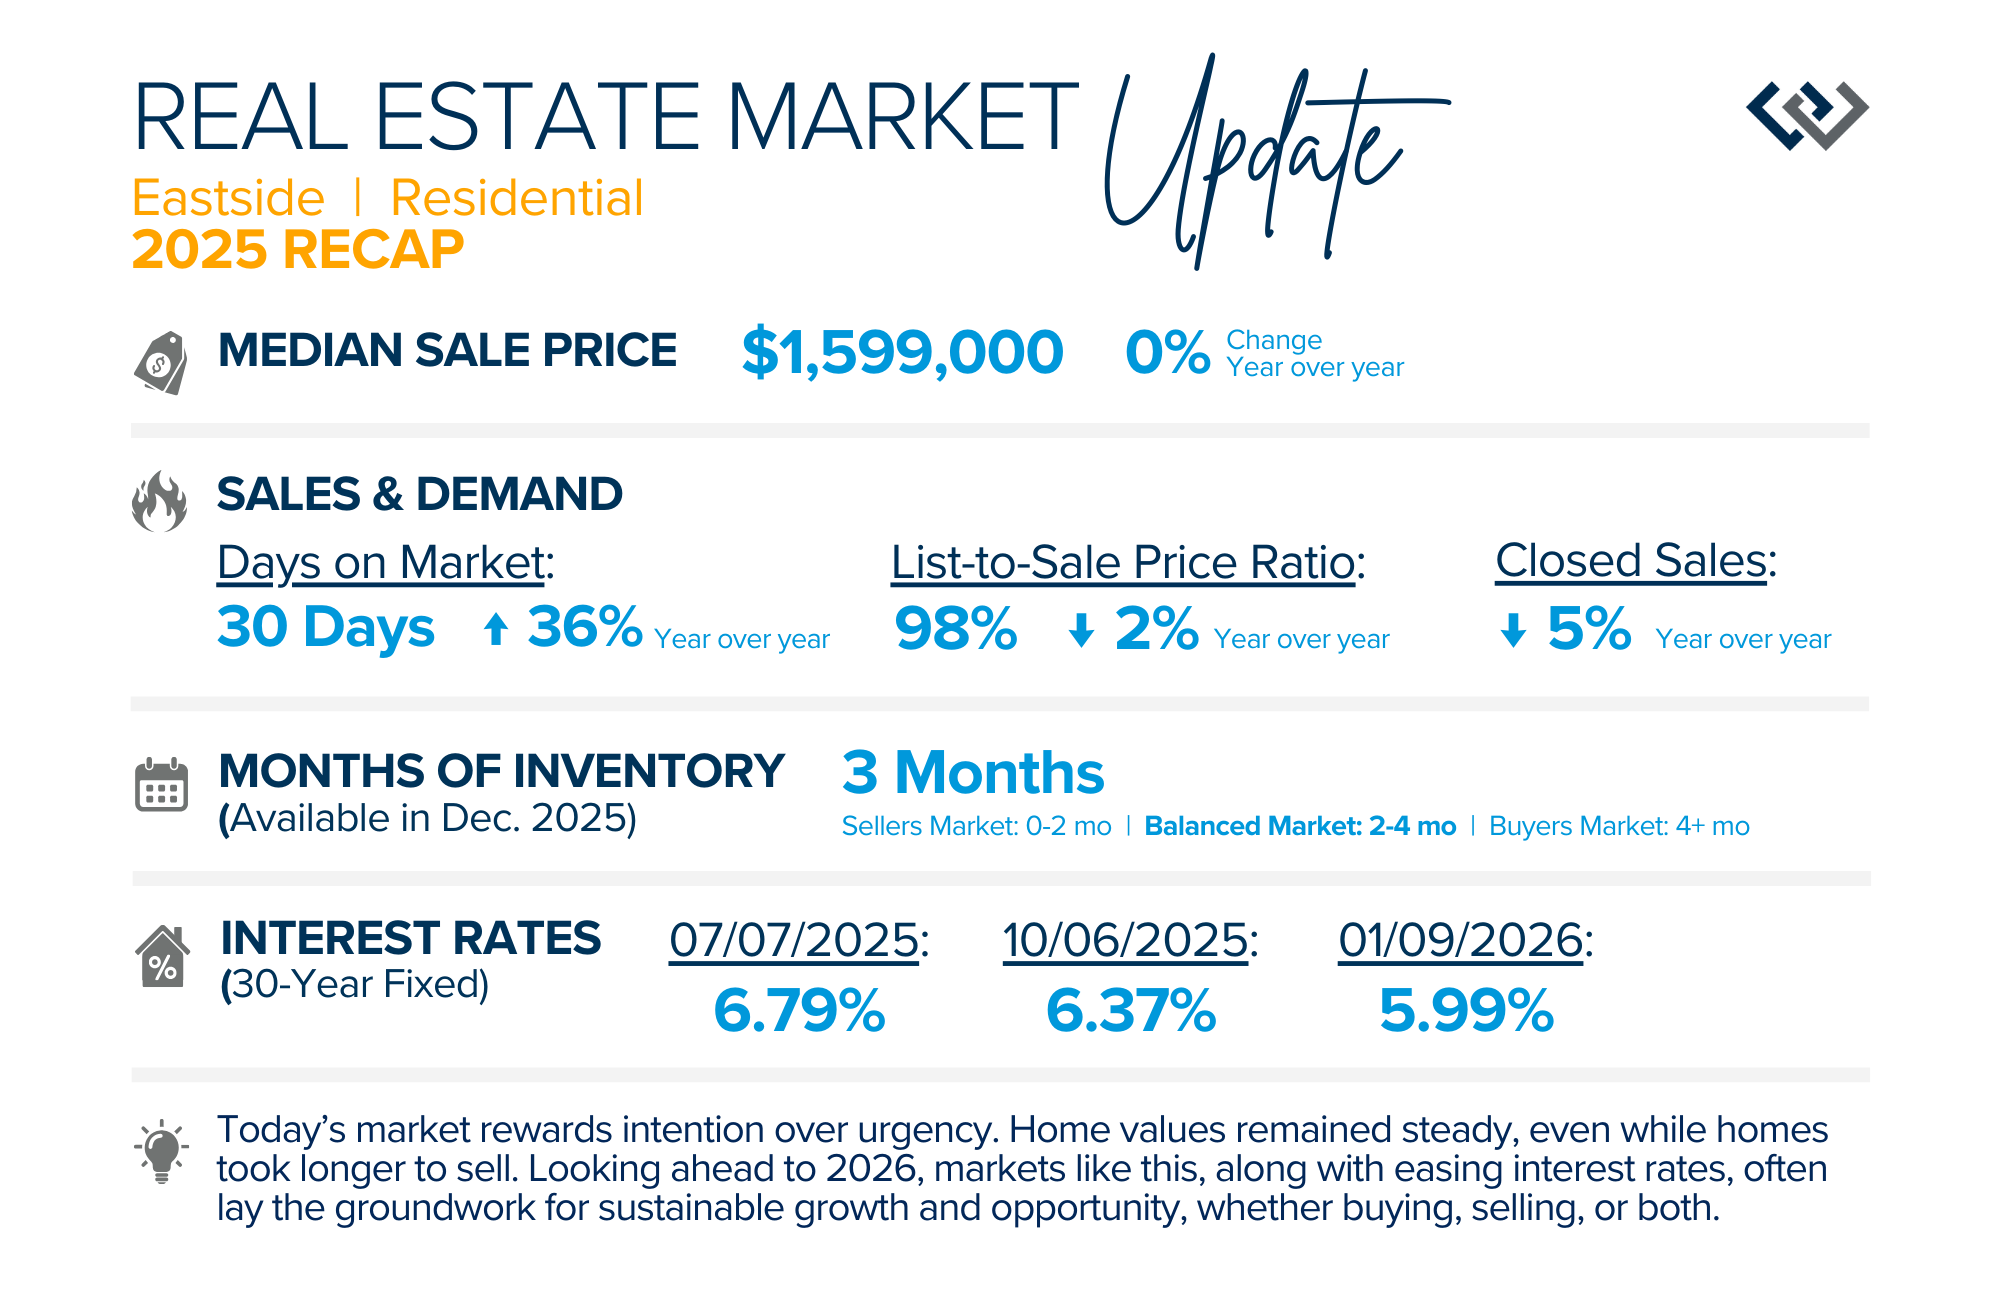
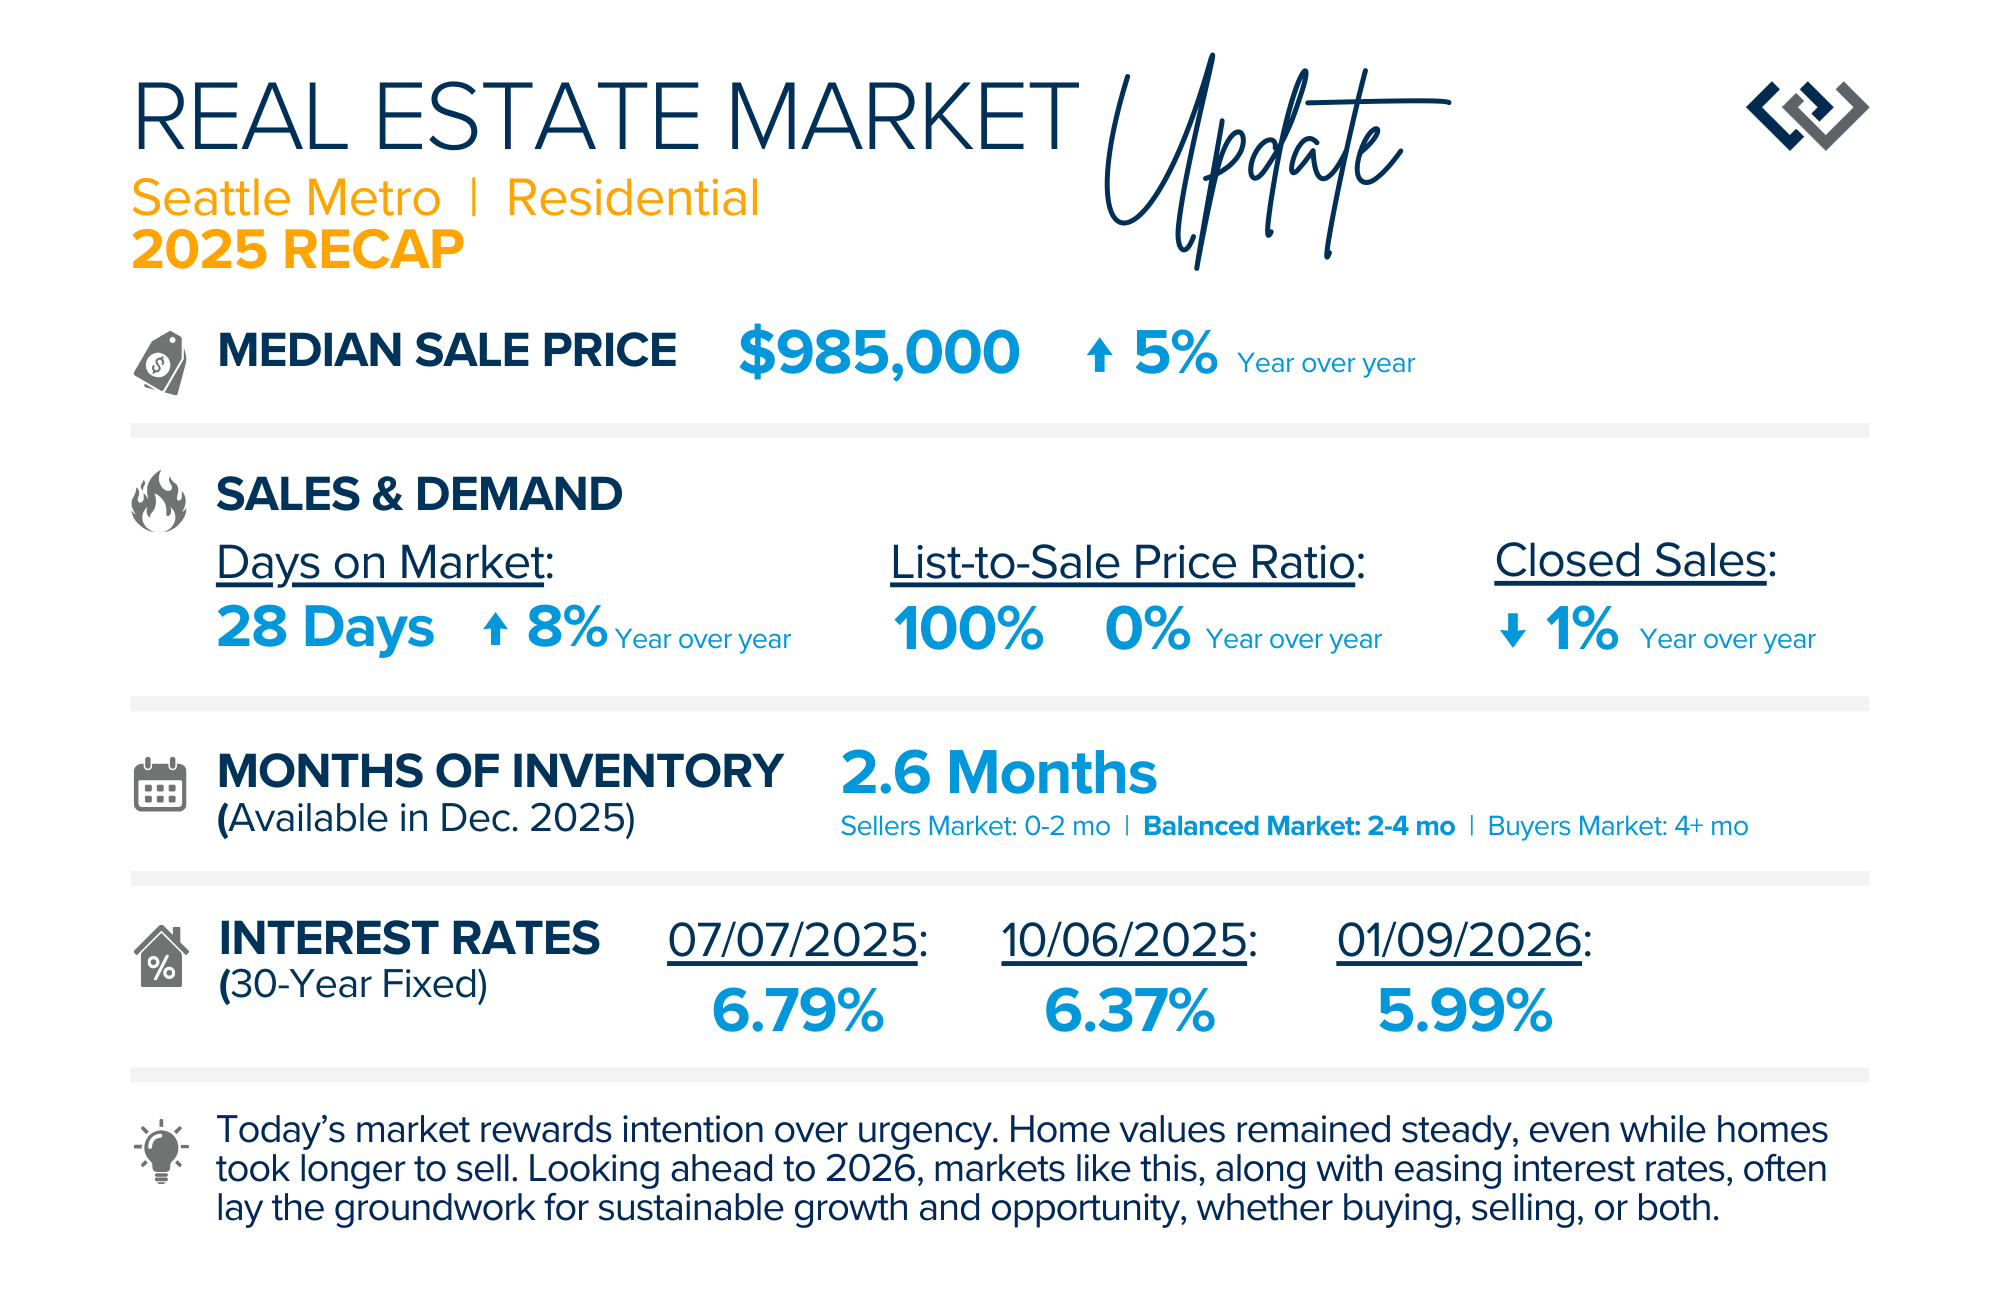
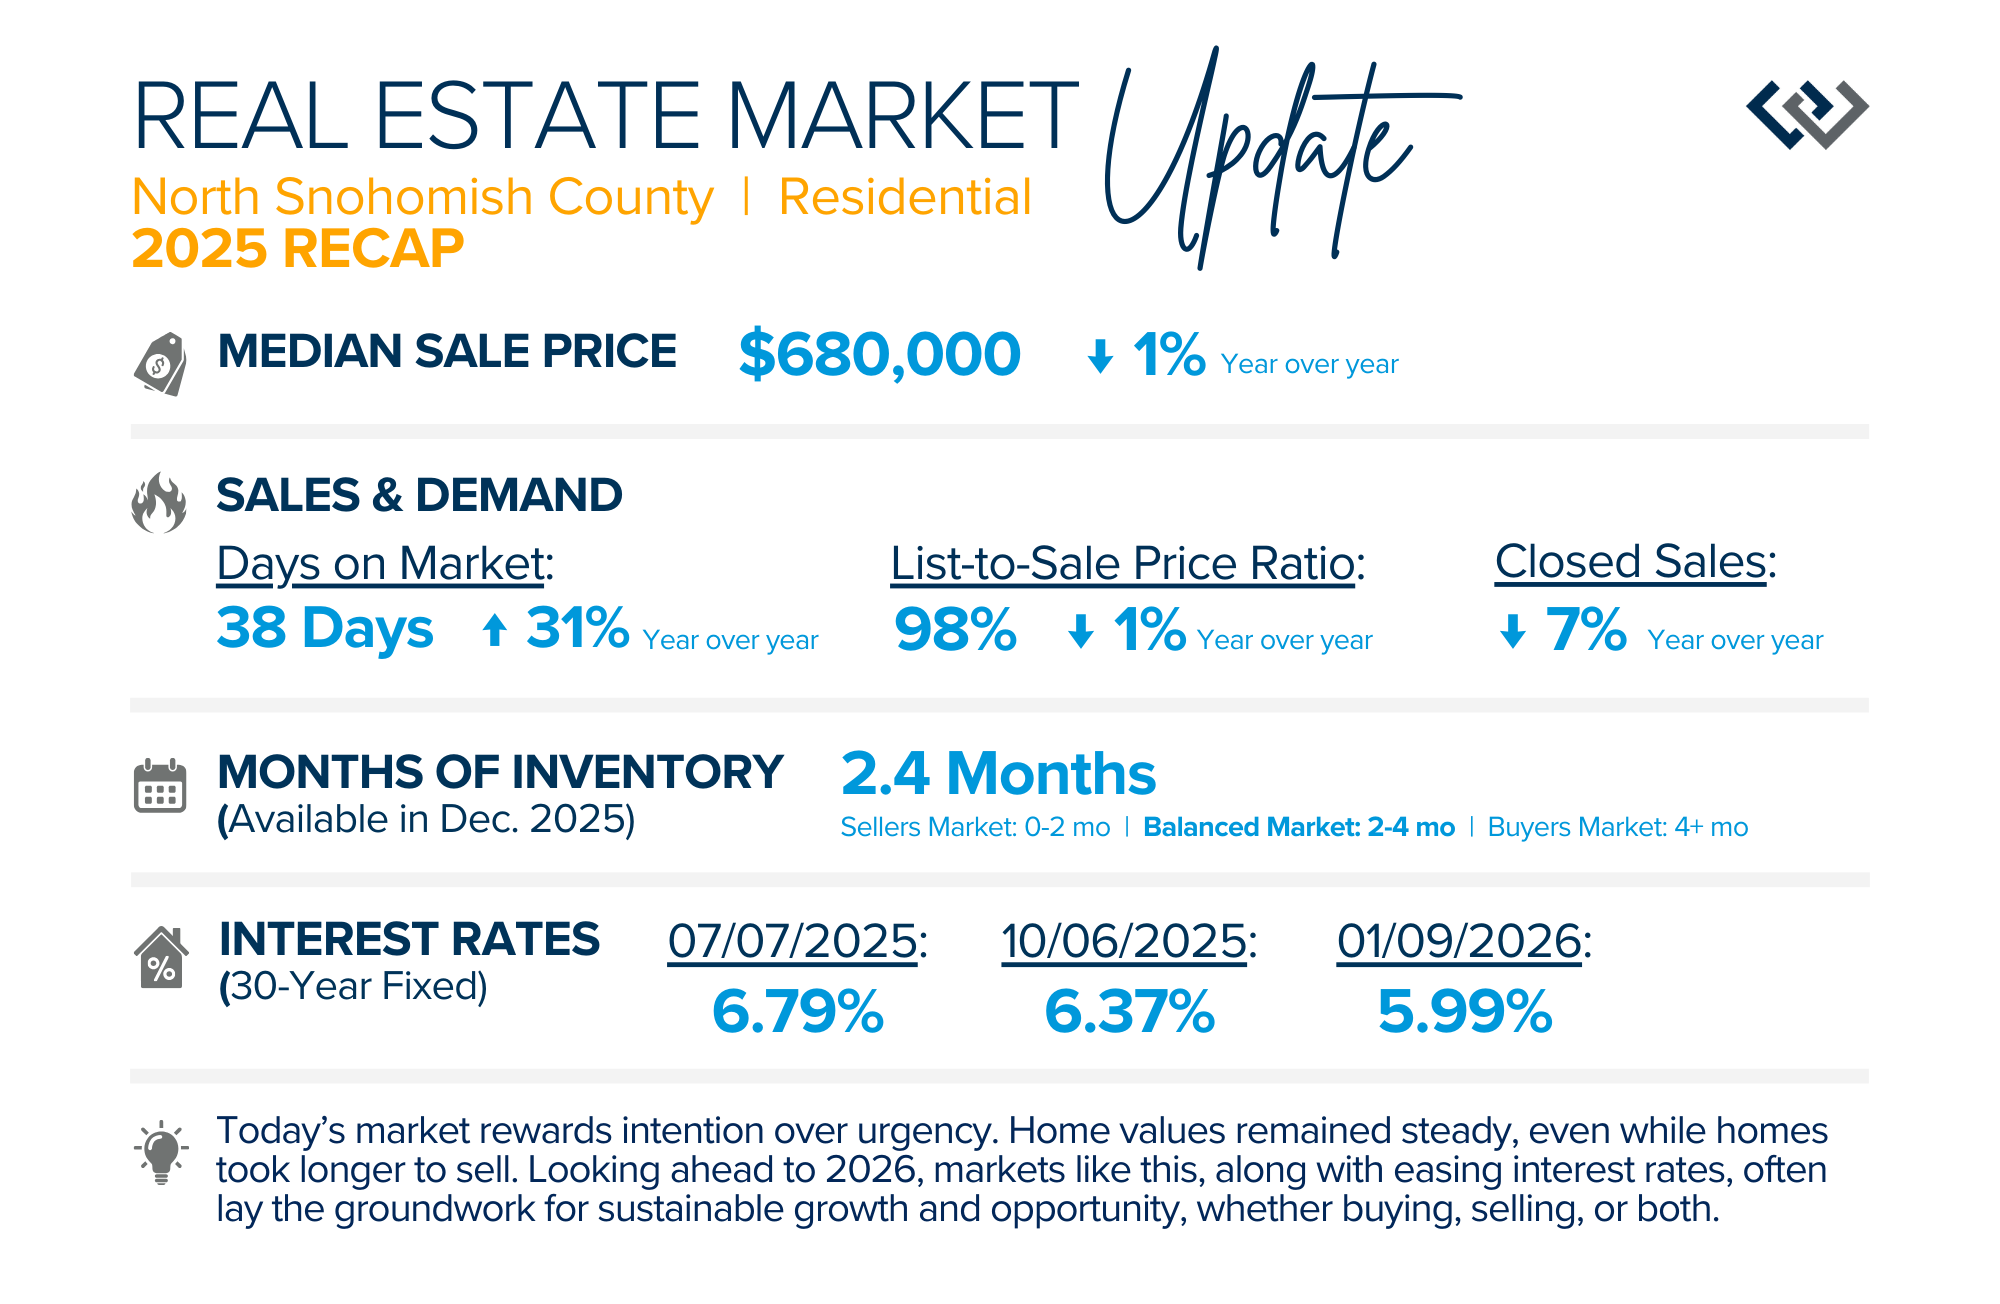
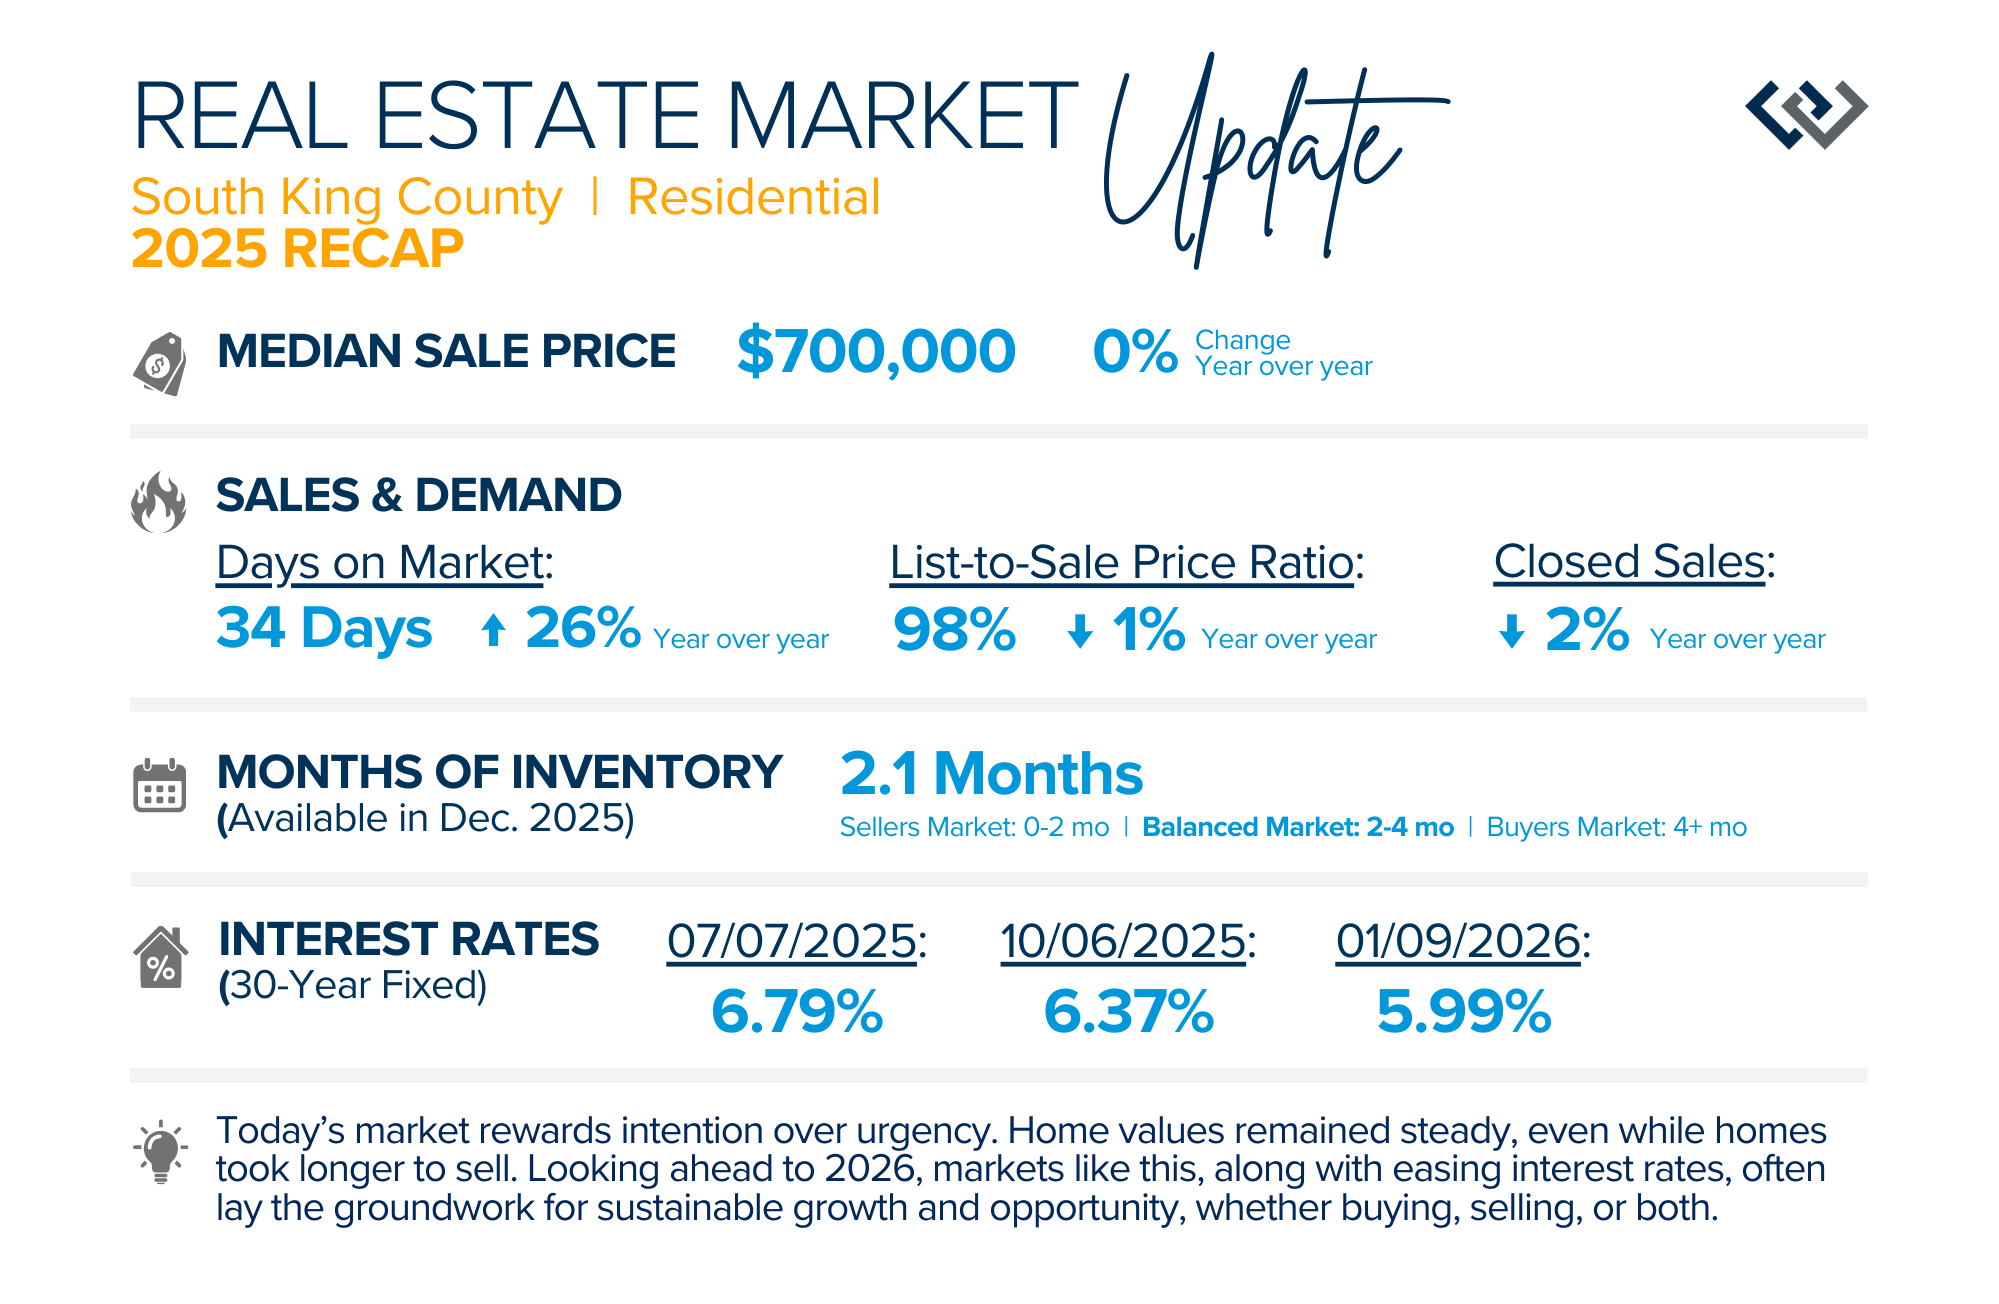
QUARTERLY REPORTS Q4 2025

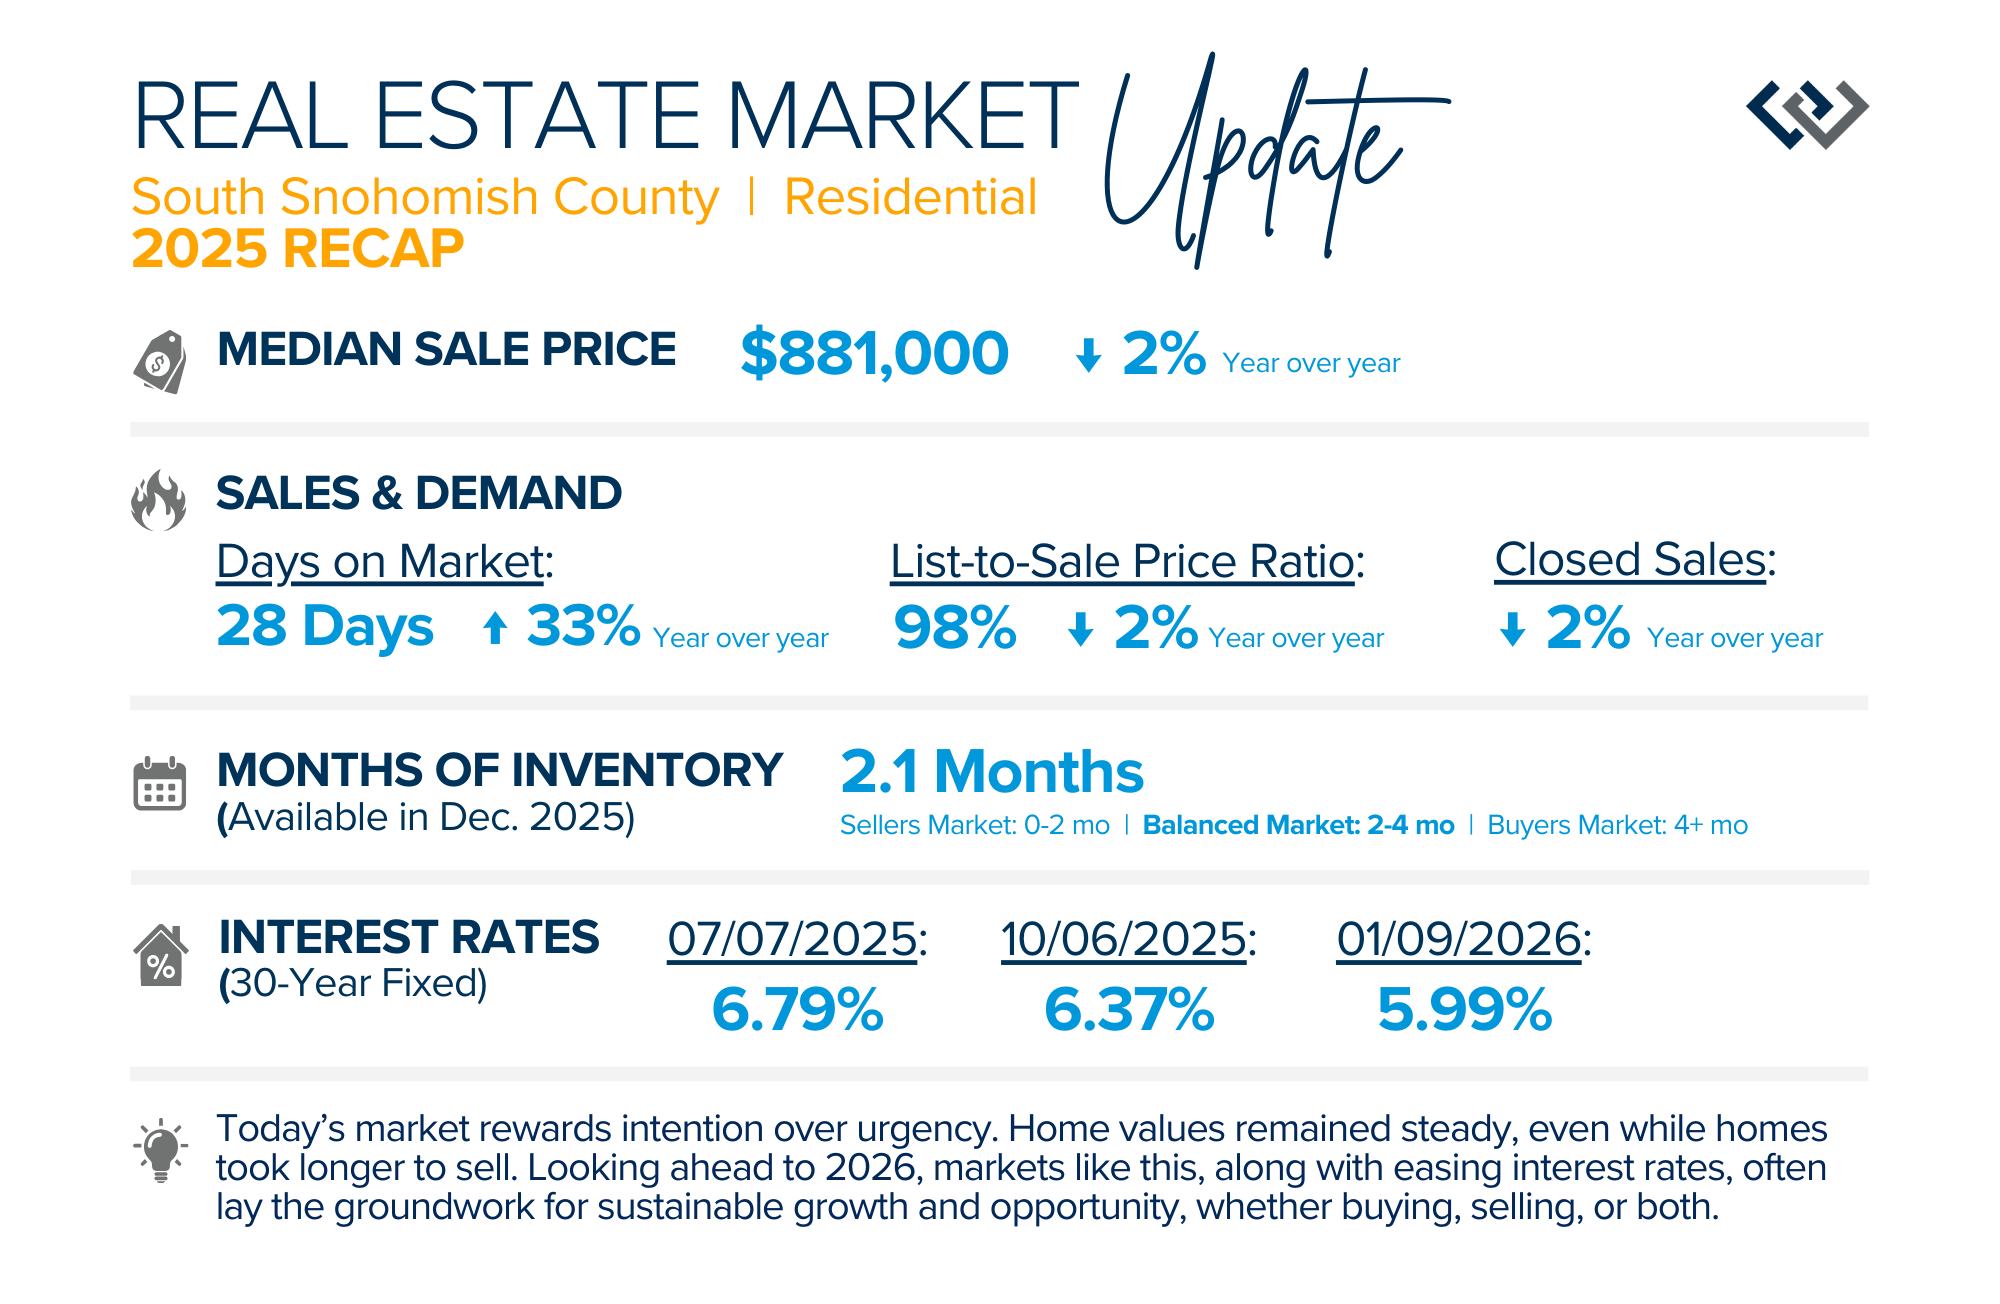
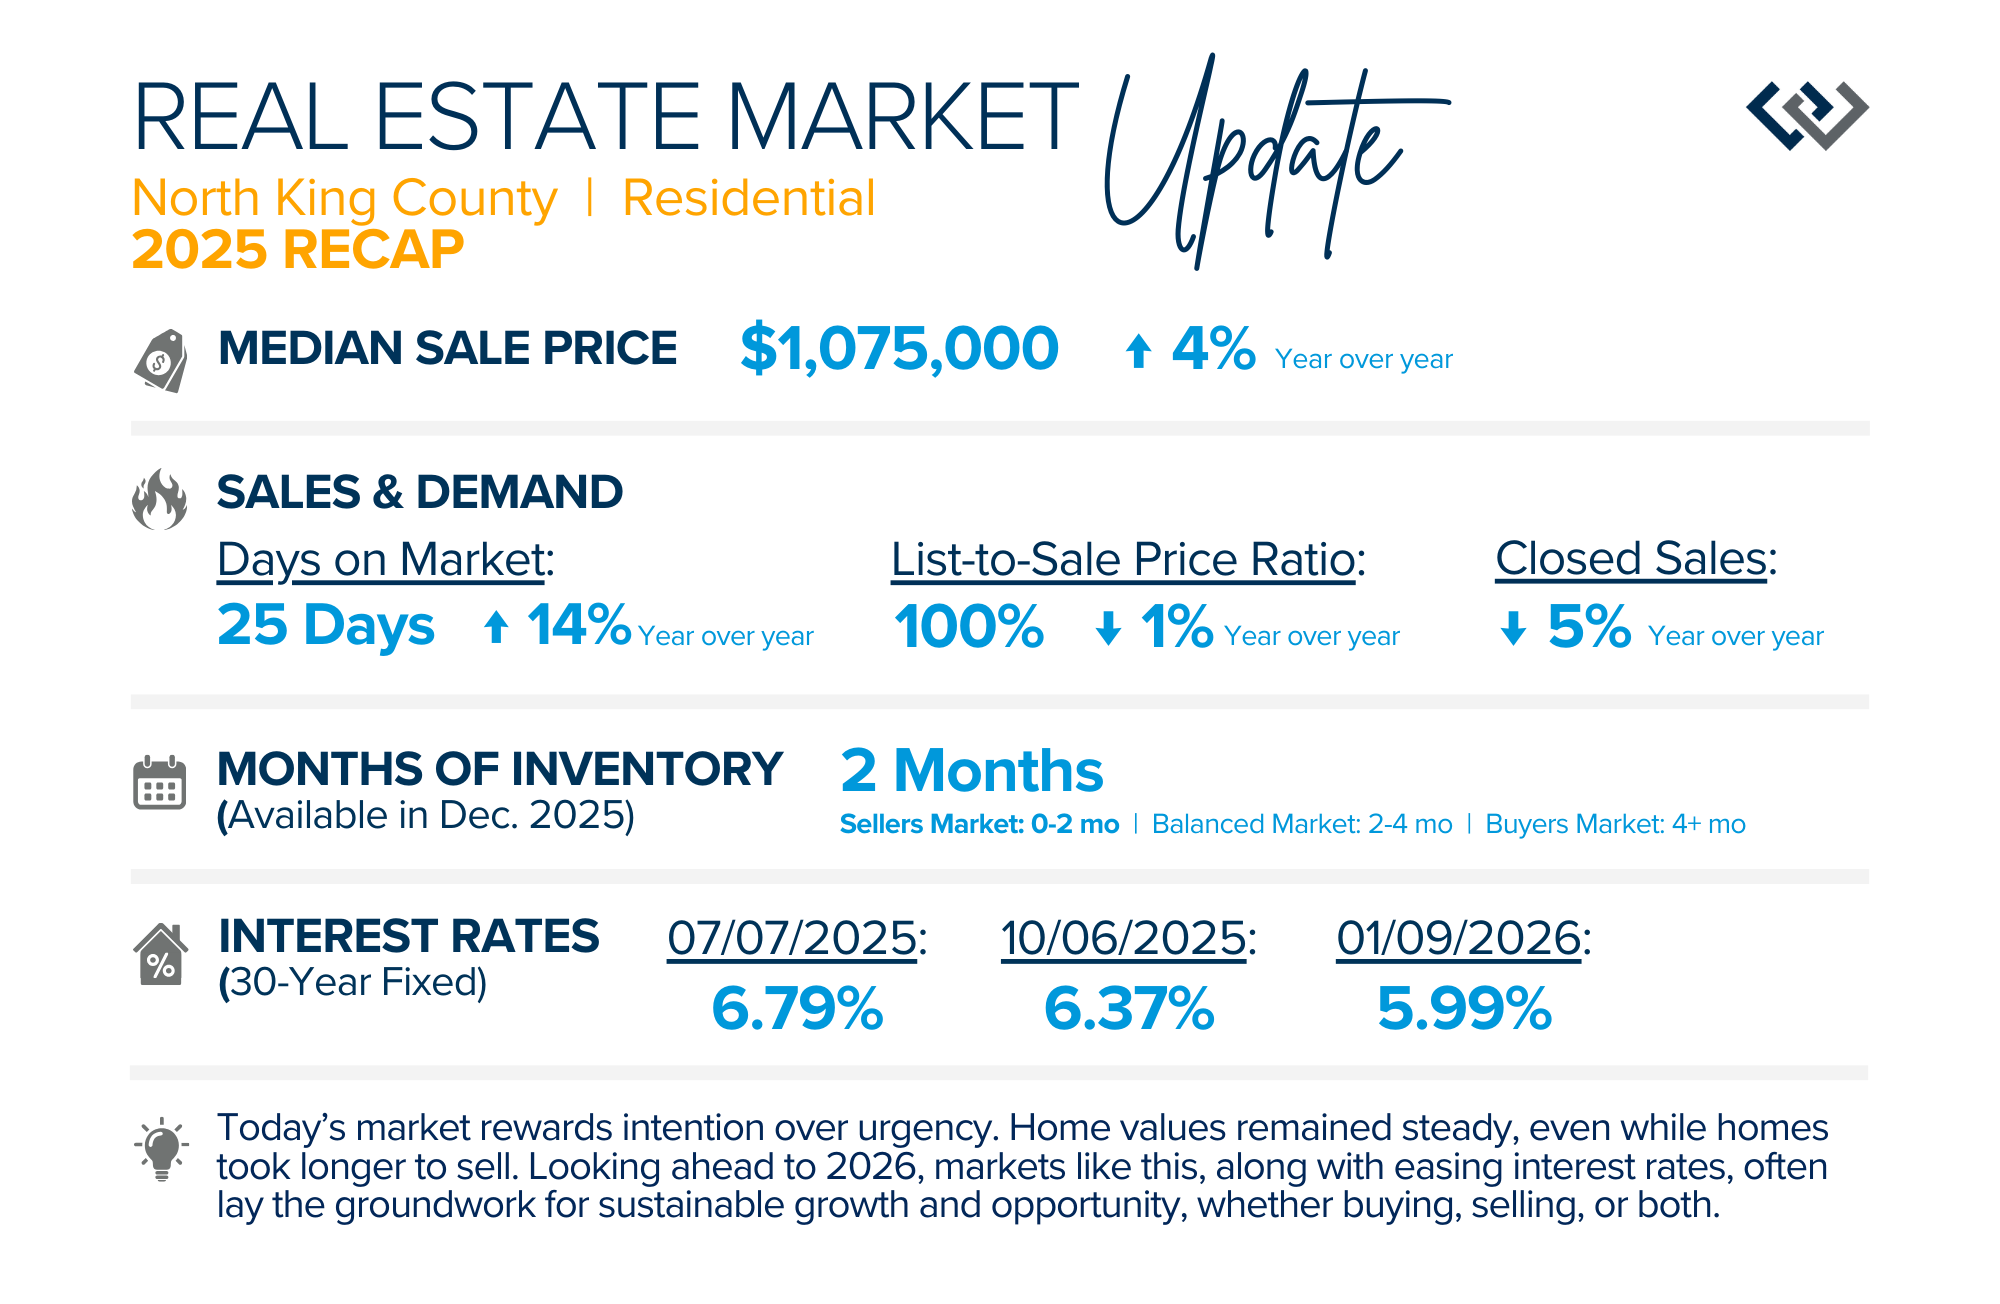
Today’s market rewards intention over urgency. Throughout 2025, sellers who focused on thoughtful preparation, strategic pricing, and strong presentation continued to achieve solid outcomes—even as buyers became more selective. Home values largely held steady even while homes generally took a bit longer to sell; this reflected more selective buyers, not a lack of demand. Buyers benefited from more balanced conditions, with greater opportunity to evaluate options, negotiate thoughtfully, and make confident decisions. As mortgage rates showed signs of easing and competition normalized, the market shifted away from extremes and back toward fundamentals.
Looking ahead to 2026, markets like this often lay the groundwork for sustainable growth and opportunities — whether buying, selling, or both. If you are curious how your goals align with the trends, please reach out. It is always my goal to educate to empower strong decisions.
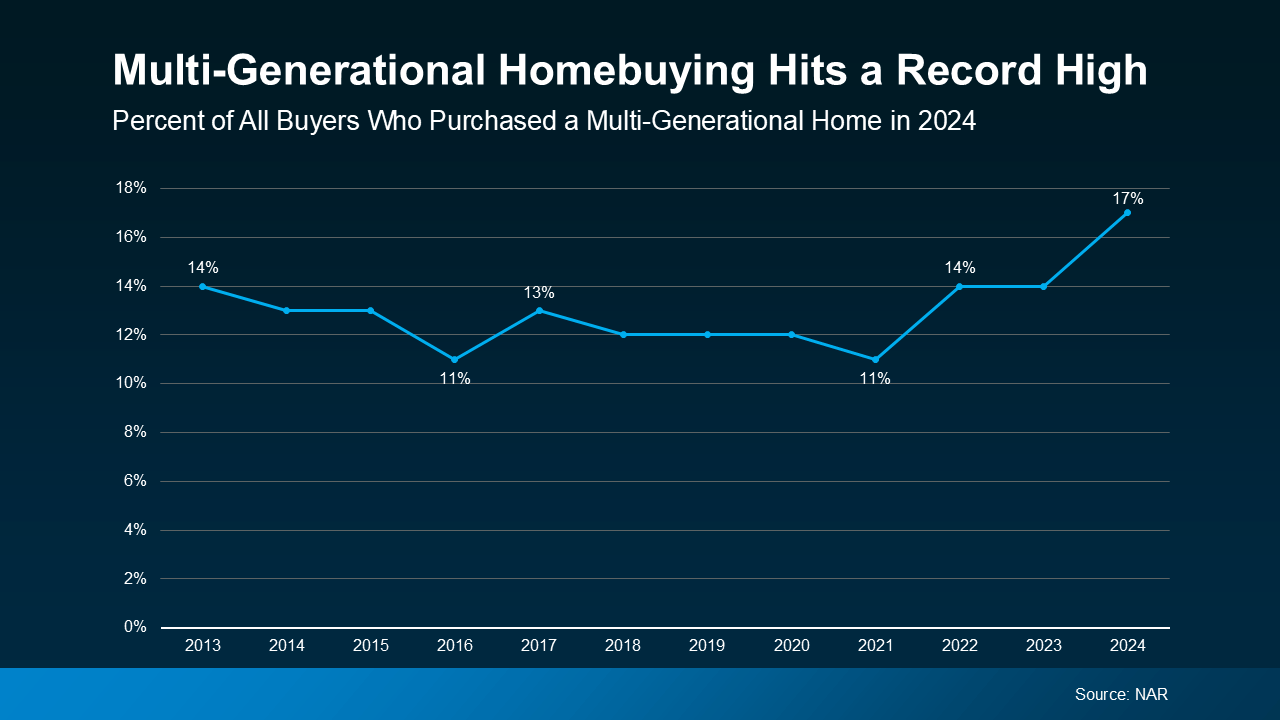
Multi-Generational Housing Solutions: How to Pool Resources, Choose the Right Property, and Build Wealth Together

As we head into the New Year and continue analyzing how to overcome affordability challenges in today’s market, I wanted to cover another important topic. In my last newsletter, we discussed house hacking strategies for first time buyers and the importance of remaining realistic about your budget and what to focus on in order to make a purchase to start building wealth and stop renting.
Another group that I’ve seen face affordability challenges are older adults whose homes no longer support their lifestyle or their current or future care needs. House hacking tips for multigenerational households is a growing trend that is worth shedding some light on. With prices remaining stable year-over-year and interest rates slowly receding, one needs to understand that values are maintaining, and creativity and strategy matter. One of the biggest conversations I’m having with clients lately—across all ages—is this: How do we stay housed, stay connected, continue to build wealth, and stay financially stable as costs keep rising?
For first-time buyers and move-up buyers, affordability can feel out of reach. For retirees on fixed incomes, housing and future care costs feel uncertain and incredibly expensive. For families, the increasing price of assisted living can be overwhelming—financially and emotionally. This isn’t just about real estate, it’s about how we take care of one another while staying financially resilient.
We were recently able to assist a first-time buyer family who was able to qualify for a mortgage with gift funds for the down payment from their parents. The monthly payments were intimidating to handle on their own with other monthly costs to consider, like childcare. Their parents were living in a retirement community that was costing a lot every month. They pooled their resources with the gift funds, the parents shifted out of the expensive retirement community, they shopped for a home with two separate levels plus room for a second kitchen, and a level entry to the daylight basement. The parents agreed to contribute to the monthly payments, which saved them substantially on their monthly overhead versus the retirement community. Now, both families are building wealth, no one is renting, and they are living comfortably and lovingly together.
There are solutions that help all ages obtain homeownership. One of the most powerful (and often overlooked) is multi-generational house hacking. This isn’t about cramming people together. It’s about thoughtful housing design and smart financing that allows families to live independently together, reduce monthly costs, and build long-term security. Here’s what that looks like in practice.
Independence First, Together by Design
The most successful multi-generational homes are designed with privacy and dignity in mind. This can include:
- A home with an ADU (accessory dwelling unit)
- A duplex or triplex where one unit is owner-occupied
- A daylight basement or in-law suite with a separate entrance
- Side-by-side living arrangements
- A second kitchen, or kitchenette, or space to build one is a bonus
When each generation has their own space, kitchens, and entrances when possible, relationships stay healthier—and living together becomes sustainable.
Housing as Cost Sharing, Not Sacrifice
In these setups, pooling funds and co-buying, having one family member rent space or contribute to the monthly mortgage, are best viewed as shared housing costs, not profit. Even modest monthly contributions can help cover:
- Mortgage payments
- Property taxes and insurance
- Utilities and maintenance
For retirees on fixed incomes, this can dramatically reduce financial pressure. For younger buyers, it can be the difference between qualifying for a home or staying on the sidelines.
Buy a Home That Can Grow with You
Some of the best multi-generational homes aren’t perfect on day one—but they have potential:
- Unfinished basements
- Bonus rooms
- Garages that could later be converted to living space
- Second kitchens or space that allows for one in the future
- Lot space to build a DADU (Detached Accessory Dwelling Unit)
This allows families to start simple and adapt over time, rather than overpaying upfront or moving again later.
Aging in Place Is Cheaper, and Kinder
Small design choices can make a home work for decades:
- Main-level bedroom and bathroom
- Walk-in showers
- Minimal stairs
- Wider doorways and hallways
These features cost far less than assisted living and allow people to remain independent, familiar, and connected to family.
Clear Agreements Protect Relationships
Even when it’s family, clarity matters. I always encourage:
- Simple written agreements
- Clear expectations around costs, timelines, and exits
- Respectful conversations before emotions get involved
Structure doesn’t reduce love; it protects it.
Privacy and Sound Matter More Than You Think
Noise is the number one reason multi-generational living breaks down. Small investments like:
- Solid-core doors
- Extra insulation
- Separate heating zones
can make a huge difference in daily comfort and long-term success.
Care Without “Institutional Living”
Multi-generational homes can provide:
- Daily check-ins without constant supervision
- Space for a future caregiver if needed
- Support without stripping autonomy
This preserves dignity and avoids the emotional and financial toll of institutional care whenever possible.
Always Stress-Test the Numbers
Before buying, it’s important to ask:
- Can one unit cover 30–50% of housing costs?
- If someone moves out, is the home still affordable, or could it be rented to someone else?
- Could the property work as a single-family home regardless?
Flexibility is what keeps a good plan from becoming a burden.
Why This Matters
Assisted living can cost $6,000–$8,000+ per month, often draining savings quickly. Multi-generational house hacking can:
- Keep families together
- Reduce monthly expenses
- Preserve independence
- Build and/or protect wealth
- Provide care with compassion
If you’re thinking about buying your first home, moving up to a larger home from your first home, helping aging parents, need a gentler floorplan, planning for retirement, or simply exploring options, I’m always happy to talk through what’s possible. Housing should build wealth and support life—not limit it. Please reach out if you’d like to discuss viable options for your family’s housing, wealth-building, and sustainability.
Affordability Strategies: House Hacking Tips to Help Overcome Monthly Payment Barriers

While we are seeing the market show signs of improvement and uptick in activity in Q4 2025, the biggest challenge we see in the real estate market is affordability. Prices in our area have remained stable after many years of appreciation, and interest rates, while improving, are hovering around 6.25%. This combination has monthly payments expensive, especially for first-time buyers and buyers on fixed incomes, such as retirees, seniors, or people looking to retire and fix their overhead.

In fact, the latest Profile of Homes Buyers and Sellers by the National Association of Realtor (NAR) shows that the rate of first-time buyers is at an all-time low, accounting for only 21% of all buyers. The median age for this group increased to age 40, the highest ever. This illustrates that affordability is putting pressure on this group and delaying their start to building long-term household wealth. The average net worth of a renter versus a homeowner is staggering, so this is an important obstacle to overcome for those who have the resources but find themselves on the bubble of this decision.

I have helped buyers overcome affordability challenges by applying some creative house hacking strategies. These are powerful tools, as they can empower a person to become a homeowner instead of renting, putting them on the path to building household wealth much faster. Plus, Greater Seattle Area rents are costly, so if one can find a way to pay their own mortgage instead of their landlord’s, they will start to build a nest egg of security for their own future.
A common myth we see is that buyers think they need 20% down to buy a home. That is simply not true, according to NAR, the average down payment for a first-time buyer was 10%. While a 20% down payment can eliminate mortgage insurance, there are loan programs such as FHA and some Conventional programs that only require 3-5% down. There are also down payment assistance programs that are available that result in 0% down, and VA financing can be as low as 0% as well.
Speaking of down payments, I see buyers diversify by utilizing or borrowing against stocks and/or 401K funds, and the NAR survey revealed 26% of first-time buyers used these types of funds to achieve their homeownership goals. It is also not uncommon for some fortunate buyers to receive gift funds in order to achieve homeownership, and the NAR survey showed 22% of first-time buyers were able to utilize this route. With the big picture of building household wealth in mind and the fact that everyone needs a roof over their head, having your home be a part of your investment portfolio makes sense.
House Hacking Tips for First-Time Buyers
The “Live in One, Rent the Rest” Starter Play
Shop 2–4 unit properties (duplex/triplex/fourplex). When you buy a multi-unit property and live in one unit, you get to enjoy owner-occupied financing rates. You can live in one of the units and rent the other(s) to help offset your mortgage payment. This could even allow for a lower down payment. It is important to calculate your potential monthly payment and assess rental rates in the area to figure out how having a renter(s) would help offset your monthly overhead. Also, consider if you had a vacancy, could you still make it work while you tried to fill it.
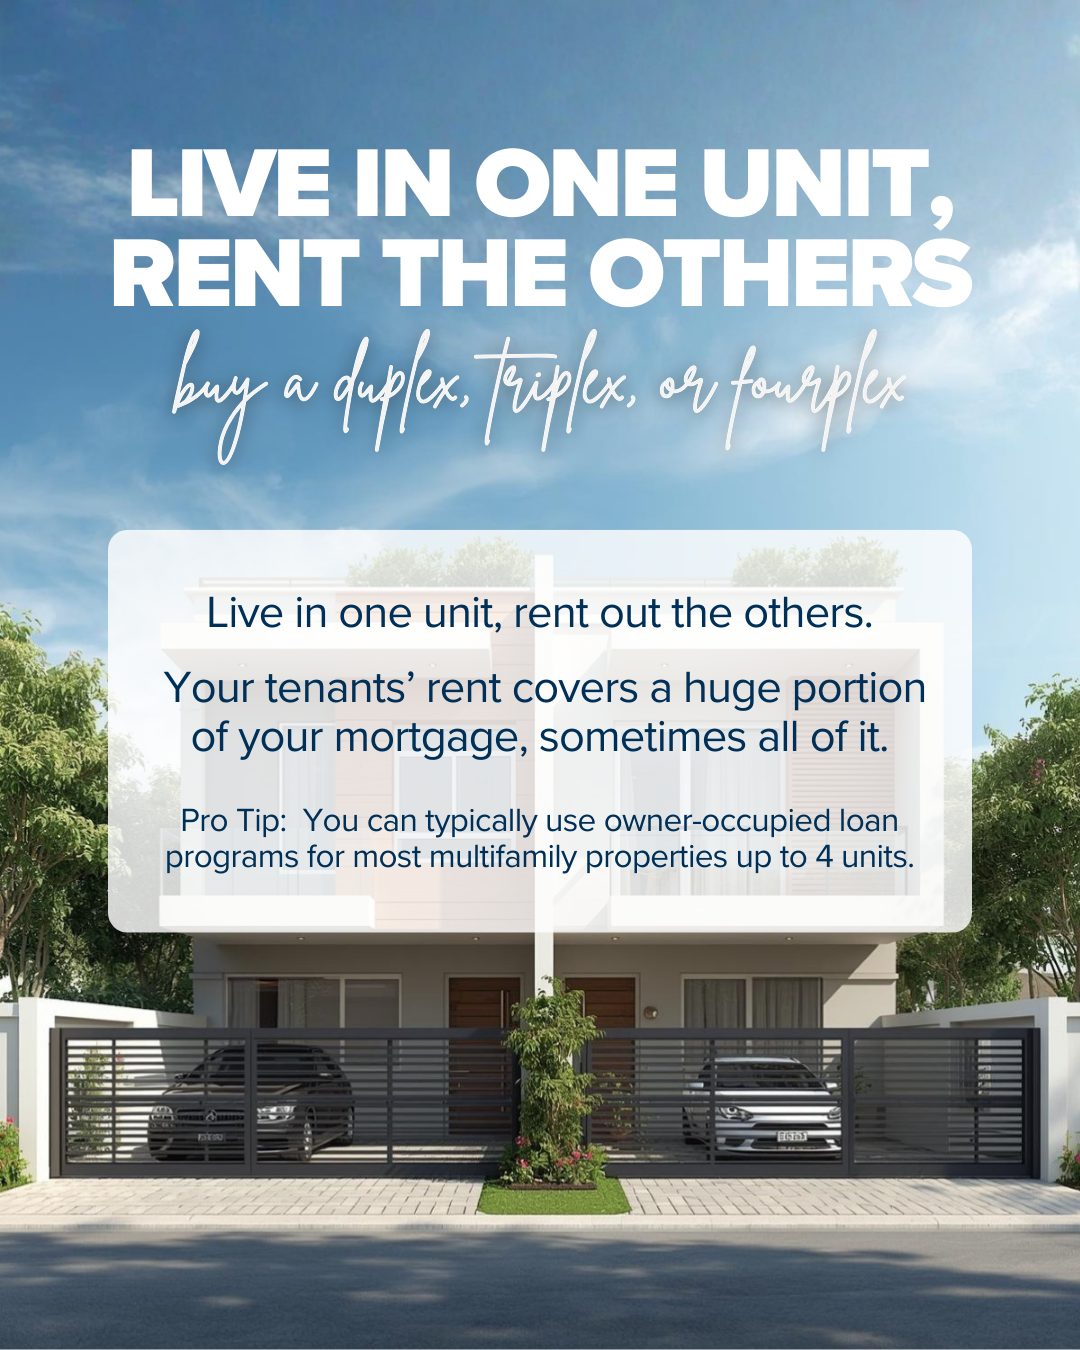
If the numbers work for your monthly cash flow, this is an excellent way to obtain homeownership. Down the road, you are building equity while someone else helps pay down your mortgage. Further, if you wanted to eventually move on to another property, you could sell this and reap the equity for a larger down payment or keep the property (at the owner-occupied financing rate) and rent all the units.
ADU Options
Seattle allows up to two ADUs per lot, and no owner-occupancy requirement (you don’t have to live there forever to keep it legal). Parking requirements are relaxed, too. Outside of Seattle these zoning requirements vary, but this is a rising trend.
You could buy a home with an existing ADU (detached cottage, basement unit, garage studio). Or buy an “ADU-ready”: daylight basement + exterior door, or garage with alley access. Start by renting a room or partial suite now, then add/finish an ADU later when cash allows.
Rent-by-the-Room to Offset Overhead
One roommate can take the edge off your payment; two roommates can be a full-on subsidy. When shopping for a home, prioritize layouts that naturally separate space (split-levels, basements, mother-in-law setups). I’ve seen some buyers already know who their roommate will be, so they can shop with confidence and also be comfortable with their living situation.

Purchase with a Trusted Partner with Similar Housing Goals.
Pooling funds for a down payment and sharing the monthly overhead is a great way to obtain homeownership with a trusted partner. This could be a close friend, family member, or domestic partner. You would ideally need to commit to at least 3-5 years of sharing the mortgage to build equity and avoid selling too early, and having a written agreement outlining the exit strategy is key. Based on average annual appreciation rates, 3-5 years would offset any selling costs and provide equity growth outside of something catastrophic happening in the market. This is a great way to protect your savings, build wealth as a team, and not throw money away on rent.

I knew two young women who pooled their savings to buy a home, and they also placed a roommate in a basement bedroom to help offset the mortgage. They later sold that house when they both got engaged and were able to buy great long-term homes with their partners using the equity they built. This partnered approach on their first home put them on the path to stability, security, and flexibility for their futures.
Buy a Cosmetic Fixer
Many buyers prefer homes that are “done” and fully updated. Those homes often come at a premium because they have a larger buyer audience. If you are willing to live with dated finishes or an unfinished space, you have the opportunity to build sweat equity with improvements you can make down the road when you can afford to.
It is important that you look for a home that’s structurally sound, as those can be expensive items to remedy, such as electrical, plumbing, roof, etc. Hiring a trusted inspector to perform proper due diligence is an important step. A dated kitchen or bathroom is a livable situation, and these homes build equity over time, too. If a home has an unfinished basement, there is an amazing opportunity to finish that space in the future and gain a higher value. Plus, you could rent this finished space to help offset the expense.
Buy a Fixer
There are renovation loans available, such as an FHA 203(k), that can be used to do more extensive repairs, additions, and updates. These loans provide funds to make improvements after closing. They are very detailed loan programs that require further scrutiny on value through appraisal and contractor bids, but can be successful in bringing a broken-down home to a livable structure and on the path to building equity. You have to be hearty and resourceful for these projects, so heed caution when considering this option. I have a great list of vendors and contractors that can help.
Most importantly, you must consider the Triangle of Buyer Clarity when shopping. Whether you are house hacking or just buying your first home without any of these creative solutions, being realistic about what you can afford is paramount. The relationship between location, price, and features/condition matters! Buyers must be flexible with their wants and understand that in reality, they typically get 70-75% of what’s on their wish list. Such as buying a townhome instead of a single-family home, settling on a location a little further away, or choosing a home that is not perfectly updated. However, they get a house and an opportunity to build wealth! This wealth-building game is a step-by-step process with every home a stepping stone over time.

As you can see, this triangle is not a perfectly balanced triangle, some sides are adjusted more than others. A buyer may have to reduce the number of features they would like in order to obtain the price and/or location they desire. This gets them on the path of equity growth, though, so compromise and flexibility are key! You need to get clear on your goals and adjust the triangle to make it work.
In my next newsletter, I will touch on house-hacking tips for multi-generational households. This can be helpful for first-time buyers as well as retirees who are on fixed incomes. This helps families stay together and avoid the high cost of assisted living. In the meantime, if you are curious about how these house hacking tips can help you or someone you know, or you’re just curious about the market, please reach out. It is always my goal to help keep you informed in order to empower strong decisions.
Do 50-Year Mortgages Really Help Buyer Affordability? Carefully consider your options and other house hacking tricks.

The recently announced proposal of implementing a 50-year mortgage product had tongues wagging last week. There were countless articles, posts and news stories that jumped on the story. There was lots of debate about whether this type of product would be a smart choice in the long term, even though it provides a lower monthly payment. It is not a mystery that the biggest challenge in the real estate market is affordability, and that finding a way to lower monthly payments could help.
Bear in mind that this is speculative at this point, and would require policy changes that would take a year or more to complete if it is decided that this product will be brought forward. And of course, a trusted mortgage professional will provide the best insights; I have a curated list if you would like one. However, I thought it was important to discuss this as it relates to the affordability challenges we are facing in today’s real estate market. In addition, I see it as an opportunity to provide alternative solutions and highlight the benefits of homeownership. So here goes.
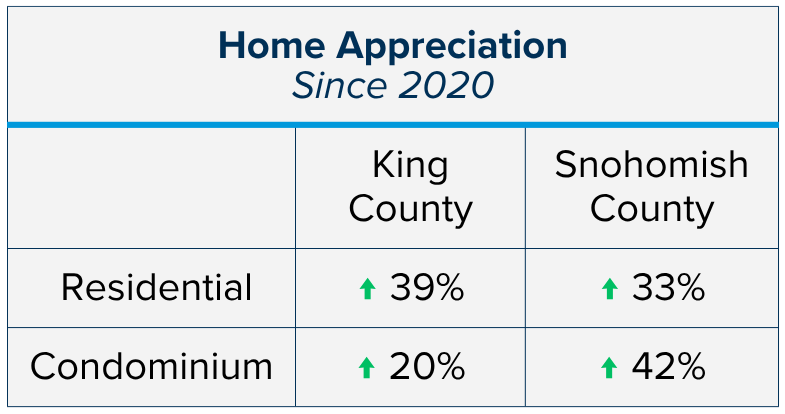
The median price for a single-family residential home in King County has increased by 39% since October 2020 and by 20% for condos. In Snohomish County, the median price for a single-family residential home has increased by 33% since October 2020 and by 42% for condos. This, coupled with higher interest rates, has caused monthly payments to jump up, sidelining some buyers.
For example, the median home price for a single-family residential home in Snohomish County in October 2020 was $570,000, and the interest rate for a 30-year fixed conventional loan was 3%, equaling a monthly principal and interest (P & I) payment of $1,922.51 based on a 20% down payment. Currently, the median home price in Snohomish County for a single-family residential home in October 2025 was $755,000, and the current rate for a 30-year fixed conventional loan is 6.25%, equaling a monthly P & I payment of $3,718.93 based on a 20% down payment. This comparison illustrates that monthly P & I payments have increased by 93% since 2020, almost double.

The good news is rates are down 1.66% from the 7.91% peak in October 2023 and down .75% from 7% since May of this year. That, along with decelerated price appreciation, has improved affordability, making now a better time than we have seen in the last two years to buy. The biggest obstacle is putting the historically low rates of the past that are not likely to return in the rearview mirror, and find other solutions to make a purchase. Perspective is key.

The 3-4% climb in rates since the pandemic heyday did not accompany a spiral in home prices. While median home prices peaked in mid-2022 as rates reached 5.5%, prices did correct but then moderated and stabilized. Year-to-date in 2025, prices have been unusually flat year-over-year in Snohomish County and up 1.4% in King County. It appears that home prices are holding and that any decrease in interest rate will only help maintain values and likely cause them to increase.
In fact, over long historical periods, many sources cite about 3% to 5% per year average appreciation nationwide. One estimate puts a long-term average appreciation at about 4.27% per year (1967-2024) nationally. More recently, over the past 5–10 years, some data shows average annual growth closer to 7%-9% due to especially strong market gains.
So, how would a 50-year mortgage help? Adding 20 more years of term to a loan will naturally lower the payment, but it increases interest payments and equity grows slower. Let’s use this example to help understand how it all pans out.
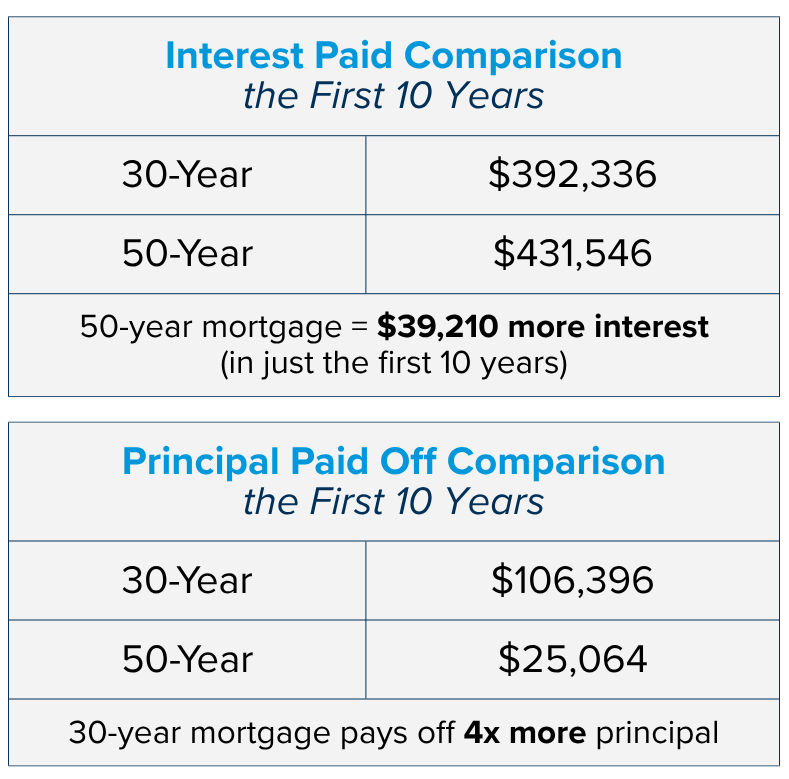
Let’s take a $750,000 home, with a 10% down payment and a conservative annual appreciation rate of 3%. Then apply an interest rate for a 30-year fixed at 6.25% and for a 50-year fixed at 6.5%. It is important to note that a longer mortgage term typically requires a higher interest rate. The 30-year product will result in a monthly P & I payment of $4,156, and the 50-year product will result in a monthly P & I payment of $3,805, a savings of $351 per month.

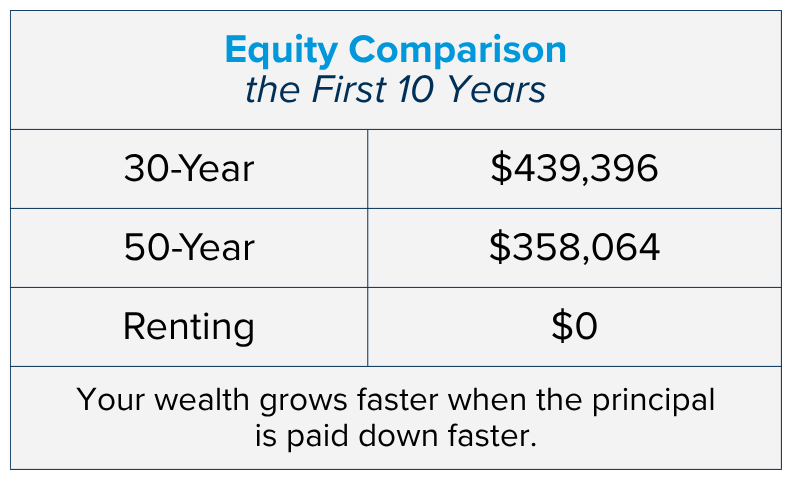
While lowering the monthly payment can be helpful to qualify for a higher loan amount and/or reduce monthly overhead, a borrower needs to consider their wealth-building strategy. In the first 10 years of the loan on a 30-year term, the borrower will pay $392,336 in interest and pay off $106,396 in principal; a total of $498,732 paid. On a 50-year term, the borrower will pay $431,546 in interest and pay off only $25,064 in principal; a total of $456,610.
Based on 3% annual price appreciation over those 10 years, the home’s value would be $1,008,000. The 30-year term borrower would have $439,396 in equity, and the 50-year term borrower would have $358,064 in equity, a $81,332 difference. Both options build more wealth vs. renting, which highlights the benefits of homeownership as one of the most powerful wealth building tools.
So, who should consider this option and who should not? And when I say consider, it doesn’t mean recommend – it means knowing your options. If this option were to show up in the future, most borrowers will review all their choices and then decide which product best suits their goals. Note, for many, waiting to qualify for a 30-year term may be a better choice given their circumstances and long-term plans.
Things to Consider With a 50-Year Mortgage
It can create a different balance between affordability and long-term cost. Here are some points to think about when deciding whether it might fit your situation:
Monthly Payment Flexibility
A longer loan term can reduce monthly payments, which may make a home feel more manageable from a month-to-month budget perspective. This can be helpful for buyers who want or need lower payments early on.
High-Cost Markets
In very expensive areas, stretching the term may make purchasing a home more attainable. It can be one way to navigate markets where prices rise faster than incomes.
Cash Flow Priorities
Some buyers prefer to keep monthly costs as low as possible so they can direct money toward:
- Investments
- Savings
- Renovations
- Other financial goals
A 50-year mortgage may support that flexibility.
Long-Term Plans for the Home
If you expect to stay in the home for a long time, the slower pace of equity building may feel acceptable in exchange for a lower monthly obligation.
Age & Income Trajectory
Younger buyers with many decades of earning ahead—or buyers anticipating future income growth—may feel comfortable taking on a longer-term loan with the idea of refinancing, selling, or paying extra over time. Although if you are able to pay extra, a 30-year loan makes more sense.
Other Factors to Keep in Mind
While there can be advantages, there are also trade-offs worth weighing:
- Total interest costs will be significantly higher over the life of the loan.
- Equity builds more slowly, which may matter if you plan to sell or refinance soon.
- It may not fit well for buyers nearing retirement or those who want a rapid payoff timeline.
A 50-year mortgage can be one tool to improve affordability or cash flow, but it’s helpful to consider how the lower monthly payments align with your long-term financial goals, timeline, and comfort with the slower accumulation of equity.
Other options that can improve buyer affordability besides a 50-year term include some house hacking tricks. And the good news is these can be used now, given that the 50-year term is only a speculative, albeit one that got a lot of attention.
Some house hacking tricks that can help offset monthly payments include: buying a duplex or a triplex and living in one of the units and renting the other(s); buying with the plan to have a roommate(s) who will pay rent and offset your monthly payment; or buying with a trusted partner and sharing the monthly payment while you build equity together. In my next newsletter, during the week of Dec 8th, I will expand on these house hacking options, plus some others, and share some success stories.
Until then, the most important thing to understand is that owning real estate builds wealth faster than renting, but how long you plan to stay in the house and your loan term matters for the long-term equity picture. That is why it is important to consult with a trusted real estate professional and a skilled lender to help you organize and execute a winning, solvent plan.
As always, it is my goal to help educate and shed light on all of your options, so you are empowered to make strong decisions. If you or someone you know is curious about how today’s market trends align with your housing goals, please reach out.
Let’s Celebrate: Equity & Inventory

As we round out 2025, we wanted to share some aspects of the current real estate market worth celebrating: equity and inventory! Below, you will see a 10-year equity study for Snohomish and King Counties, based on Single-Family Residential and Condos, along with a current assessment of inventory levels and their effects on the climate of the market. I felt it was important to bring you this information, whether you are a homeowner, renter, or if you are considering a move in the future. The market is finding balance, rates are gradually falling, and home values are maintaining.
Home equity is incredibly strong in our region and is the backbone of household wealth for many. This nest egg provides financial security, can be a vehicle to create a move to a home that is a better fit for your lifestyle, or provide the funds to do a home remodel. The long-term hold investment in real estate continues to be a bright light economically.
Inventory levels have increased over the last two years and we are experiencing balance in the market which is providing opportunities for buyers to strike with less rush and frenzy. This has been especially beneficial for those who need to sell their homes in order to make a purchase. We’ve started to see an uptick in contingent sales and bridge loans to make a move smoother and more attainable. First-time homebuyers are also seizing the opportunity to lock in a lower interest rate and the affordability of stabilizing prices. Rates have decreased by nearly 1 point since May 2025.
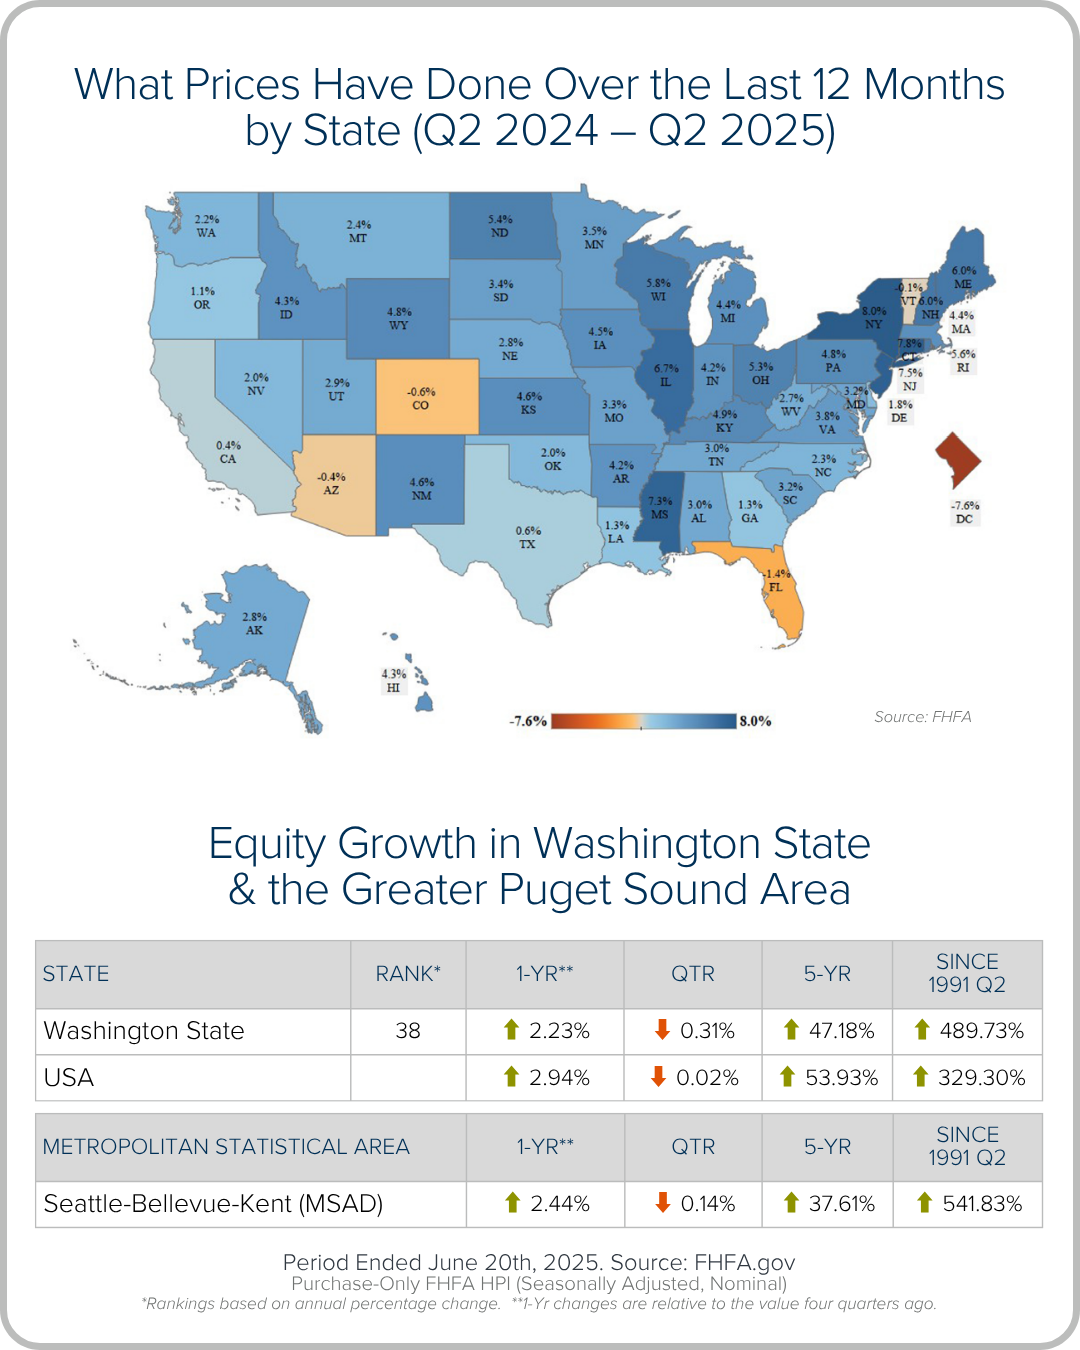
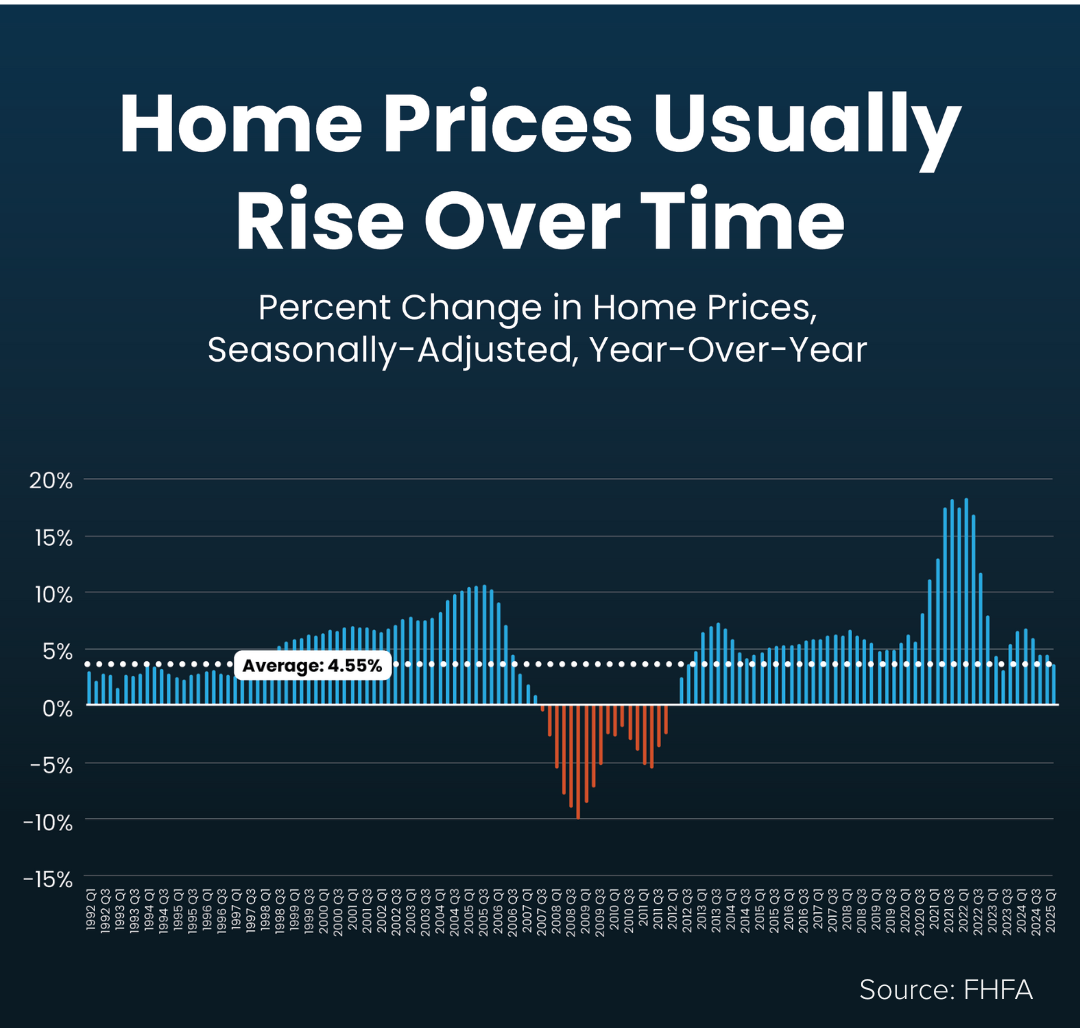
The image below from FHFA shows the long-term price growth (since 1991) in our state and metropolitan area. The figures are impressive at 480% in the state of Washington! I’d be happy to perform a custom equity study for you beyond the county information above and national figures below that is specific to your home’s specific features and today’s market trends.
Whether you own your home already or are considering building wealth through homeownership, I would love to help you analyze how equity growth and inventory levels could benefit your real estate goals. It’s always my goal to help keep you informed to empower strong financial decisions that augment your quality of life! Please reach out if you want to learn more.
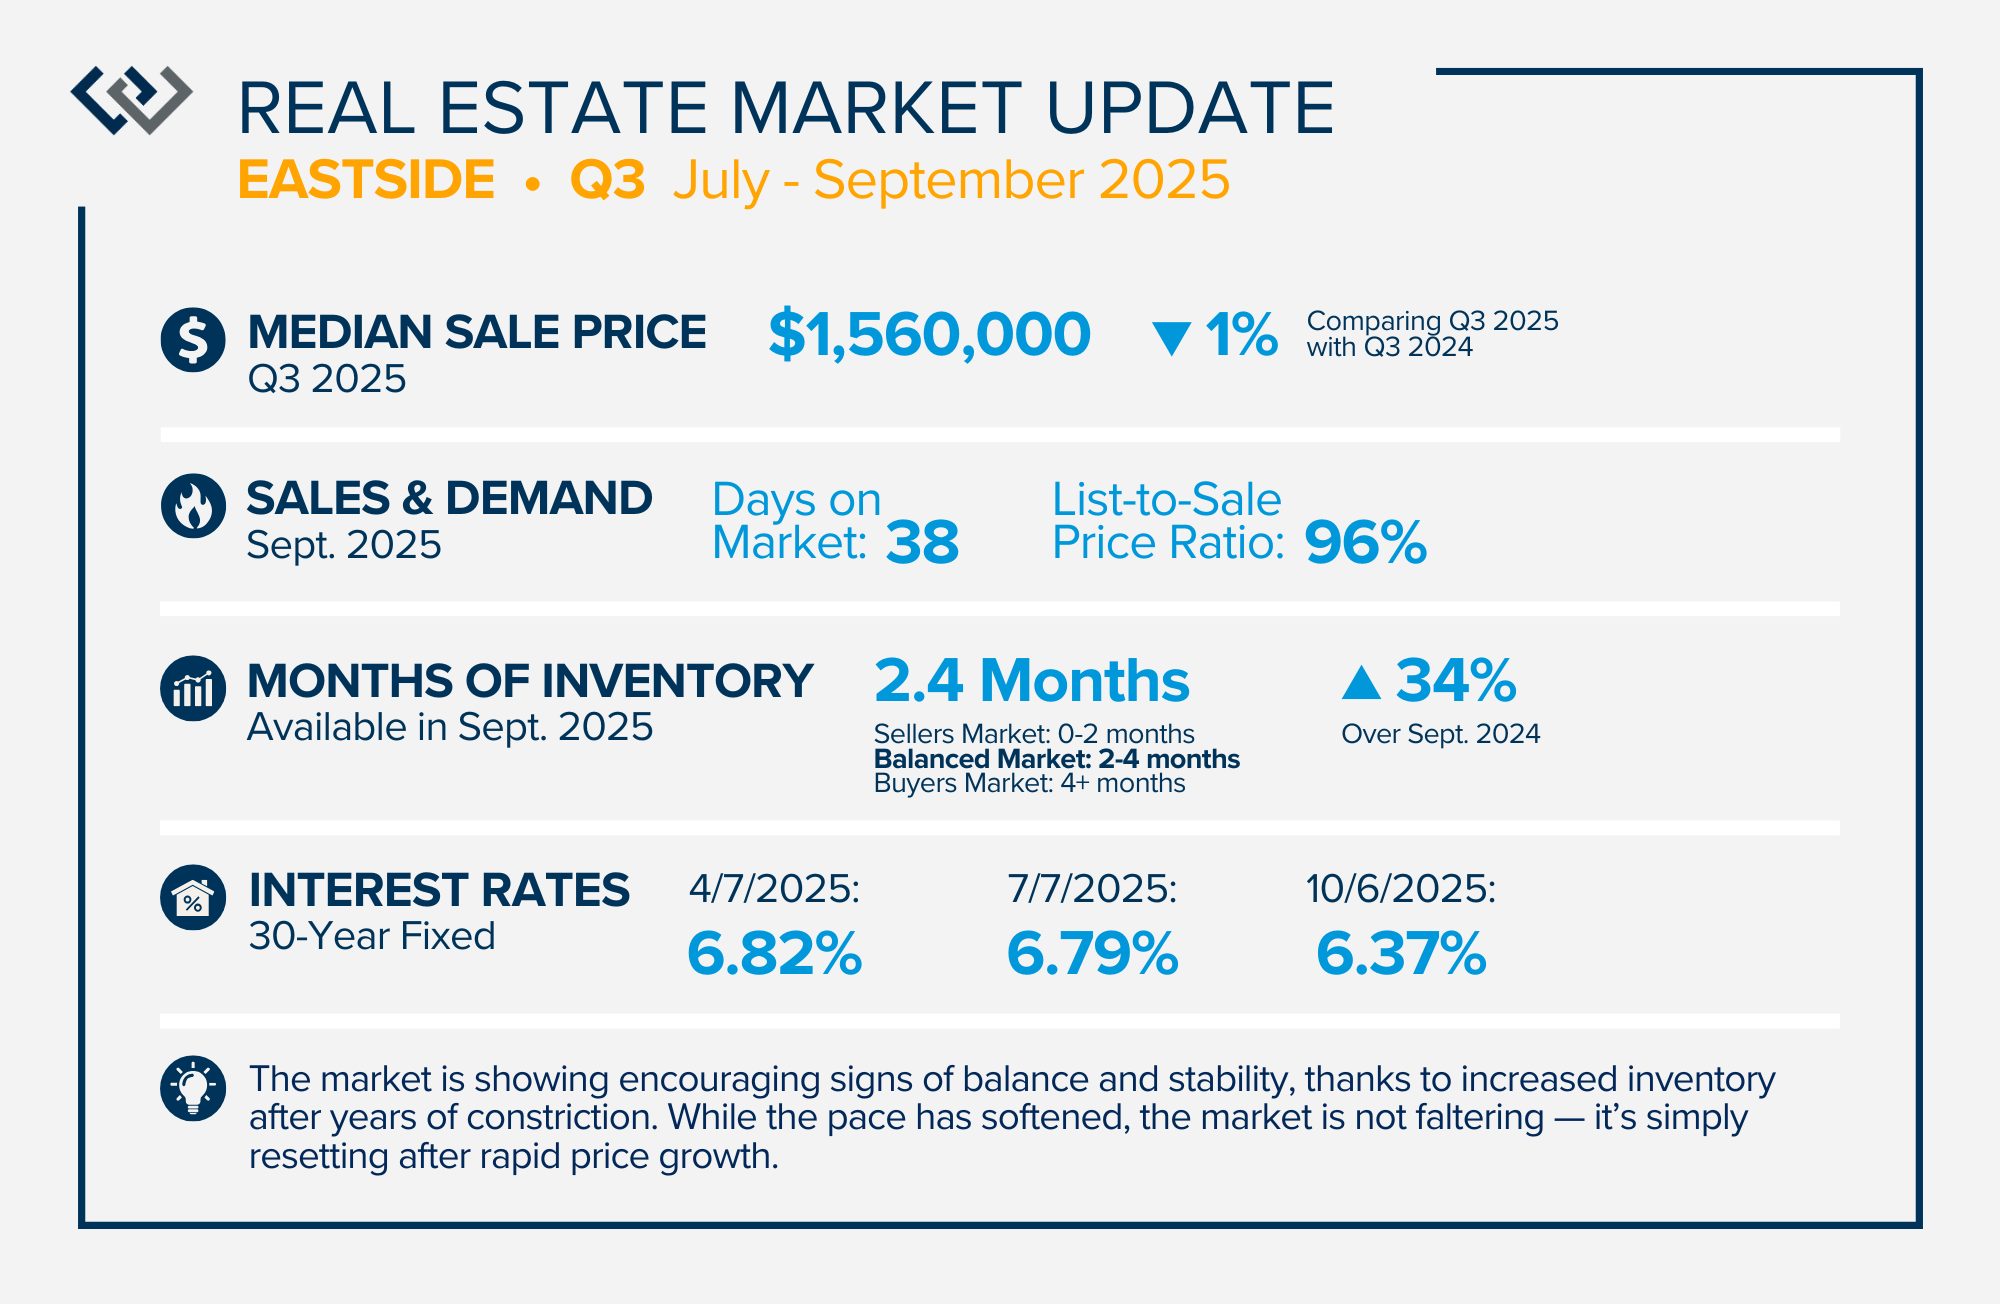
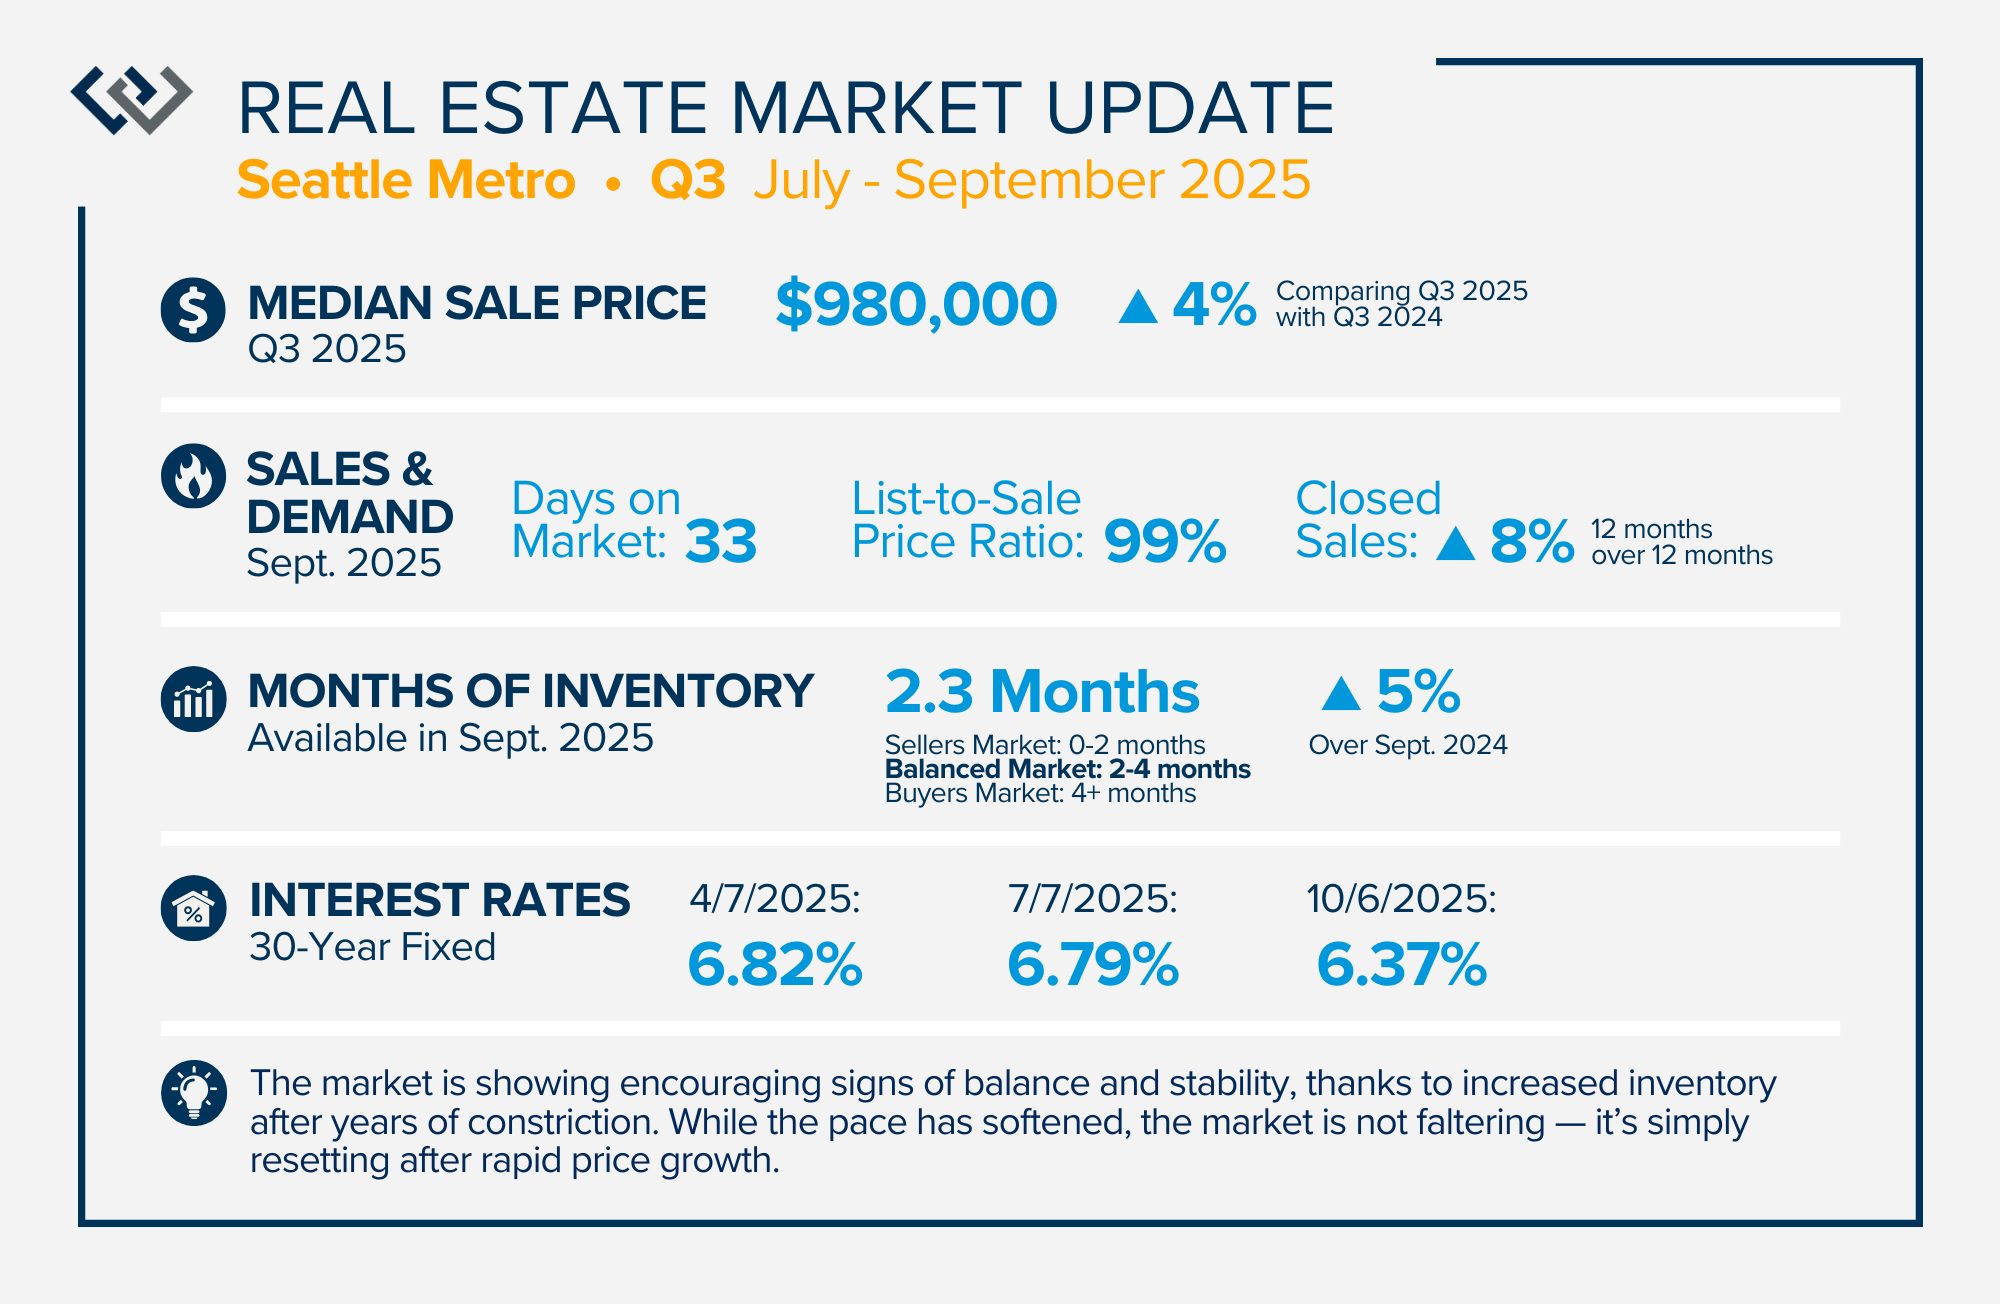
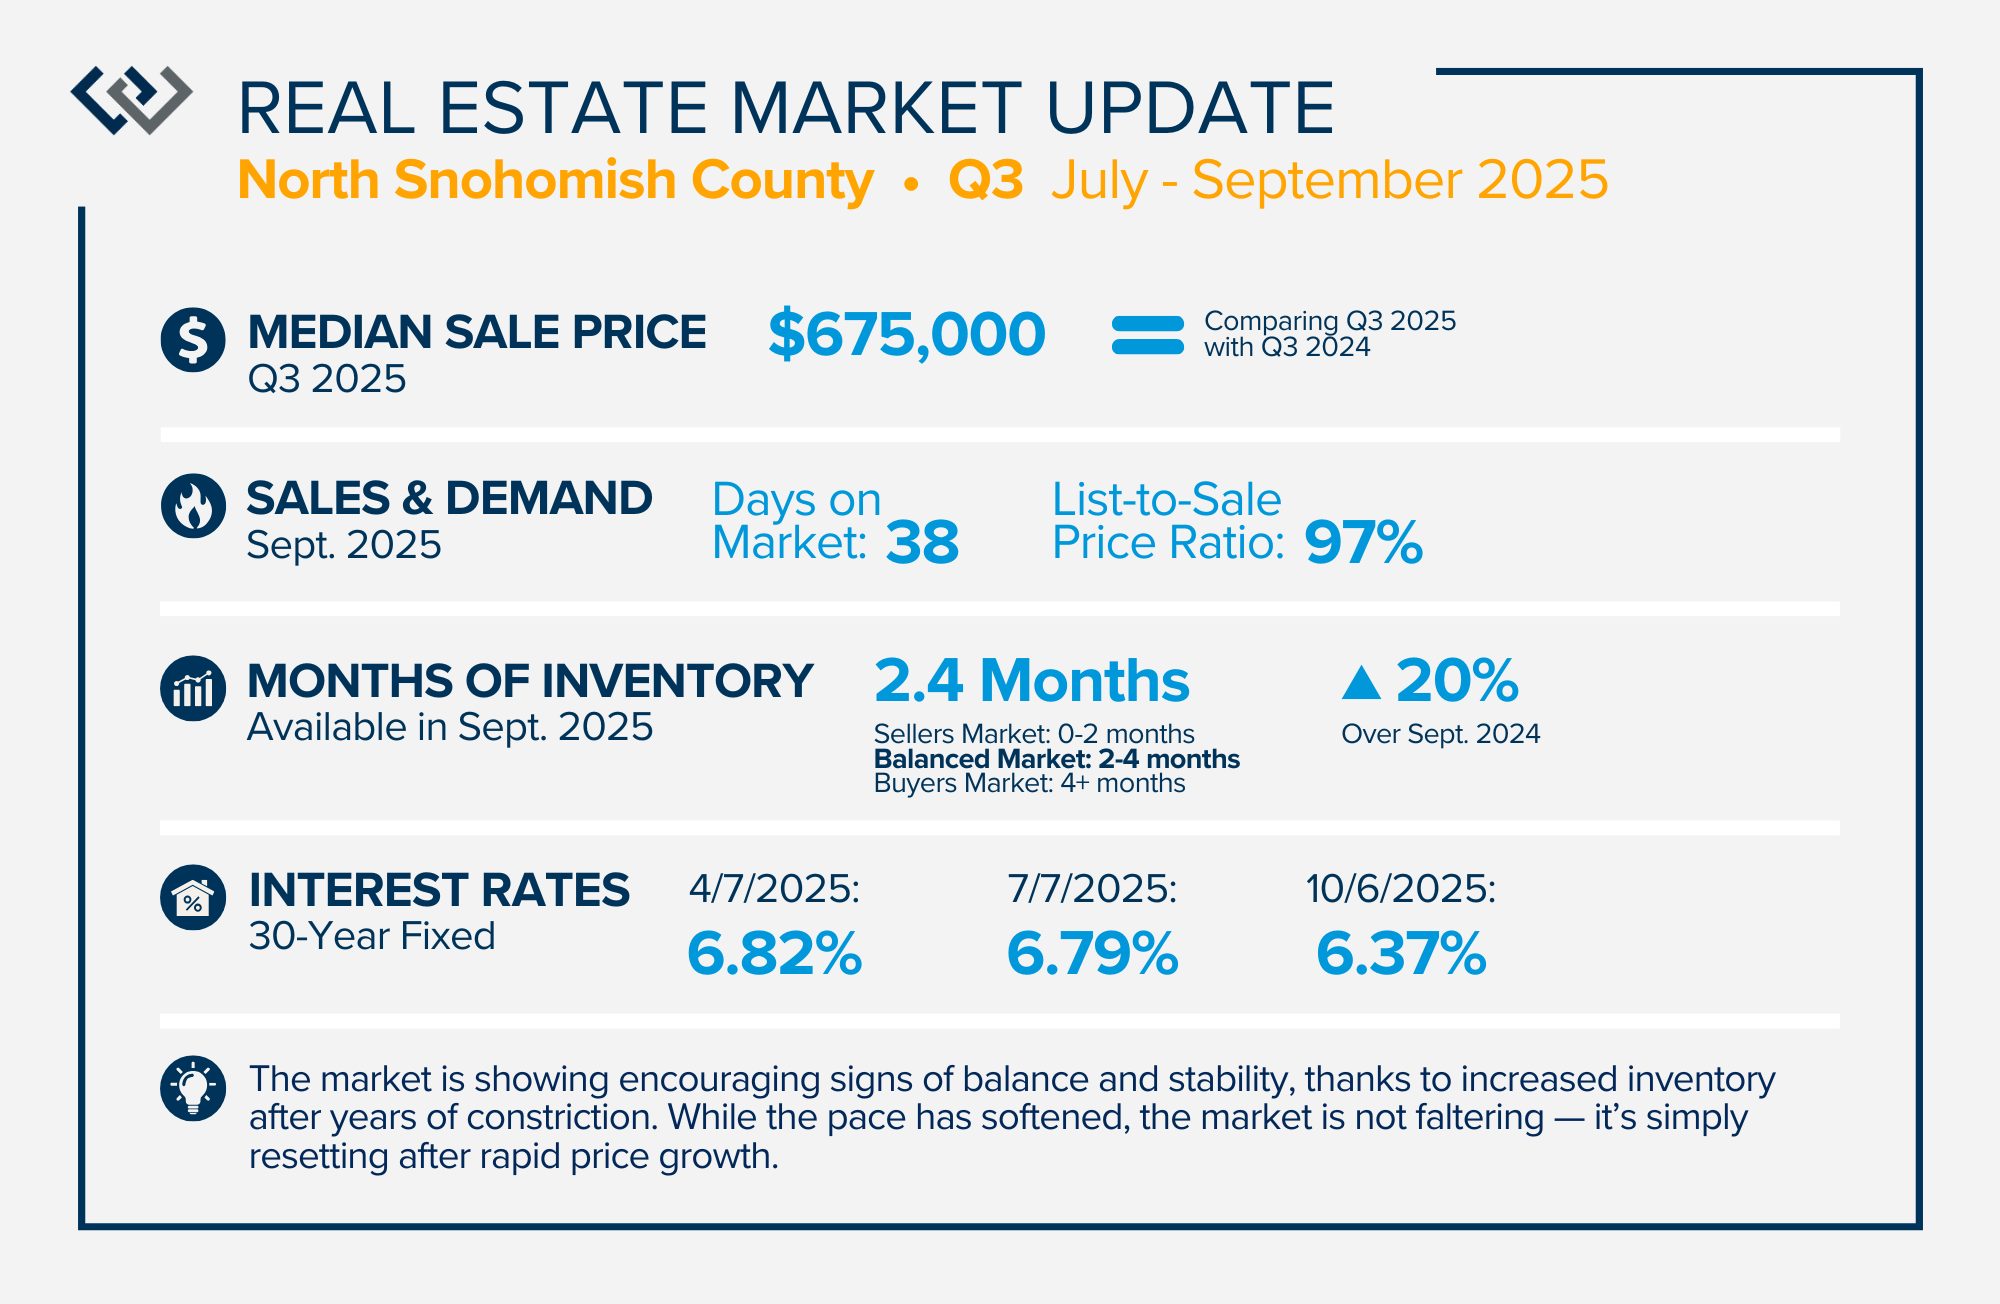
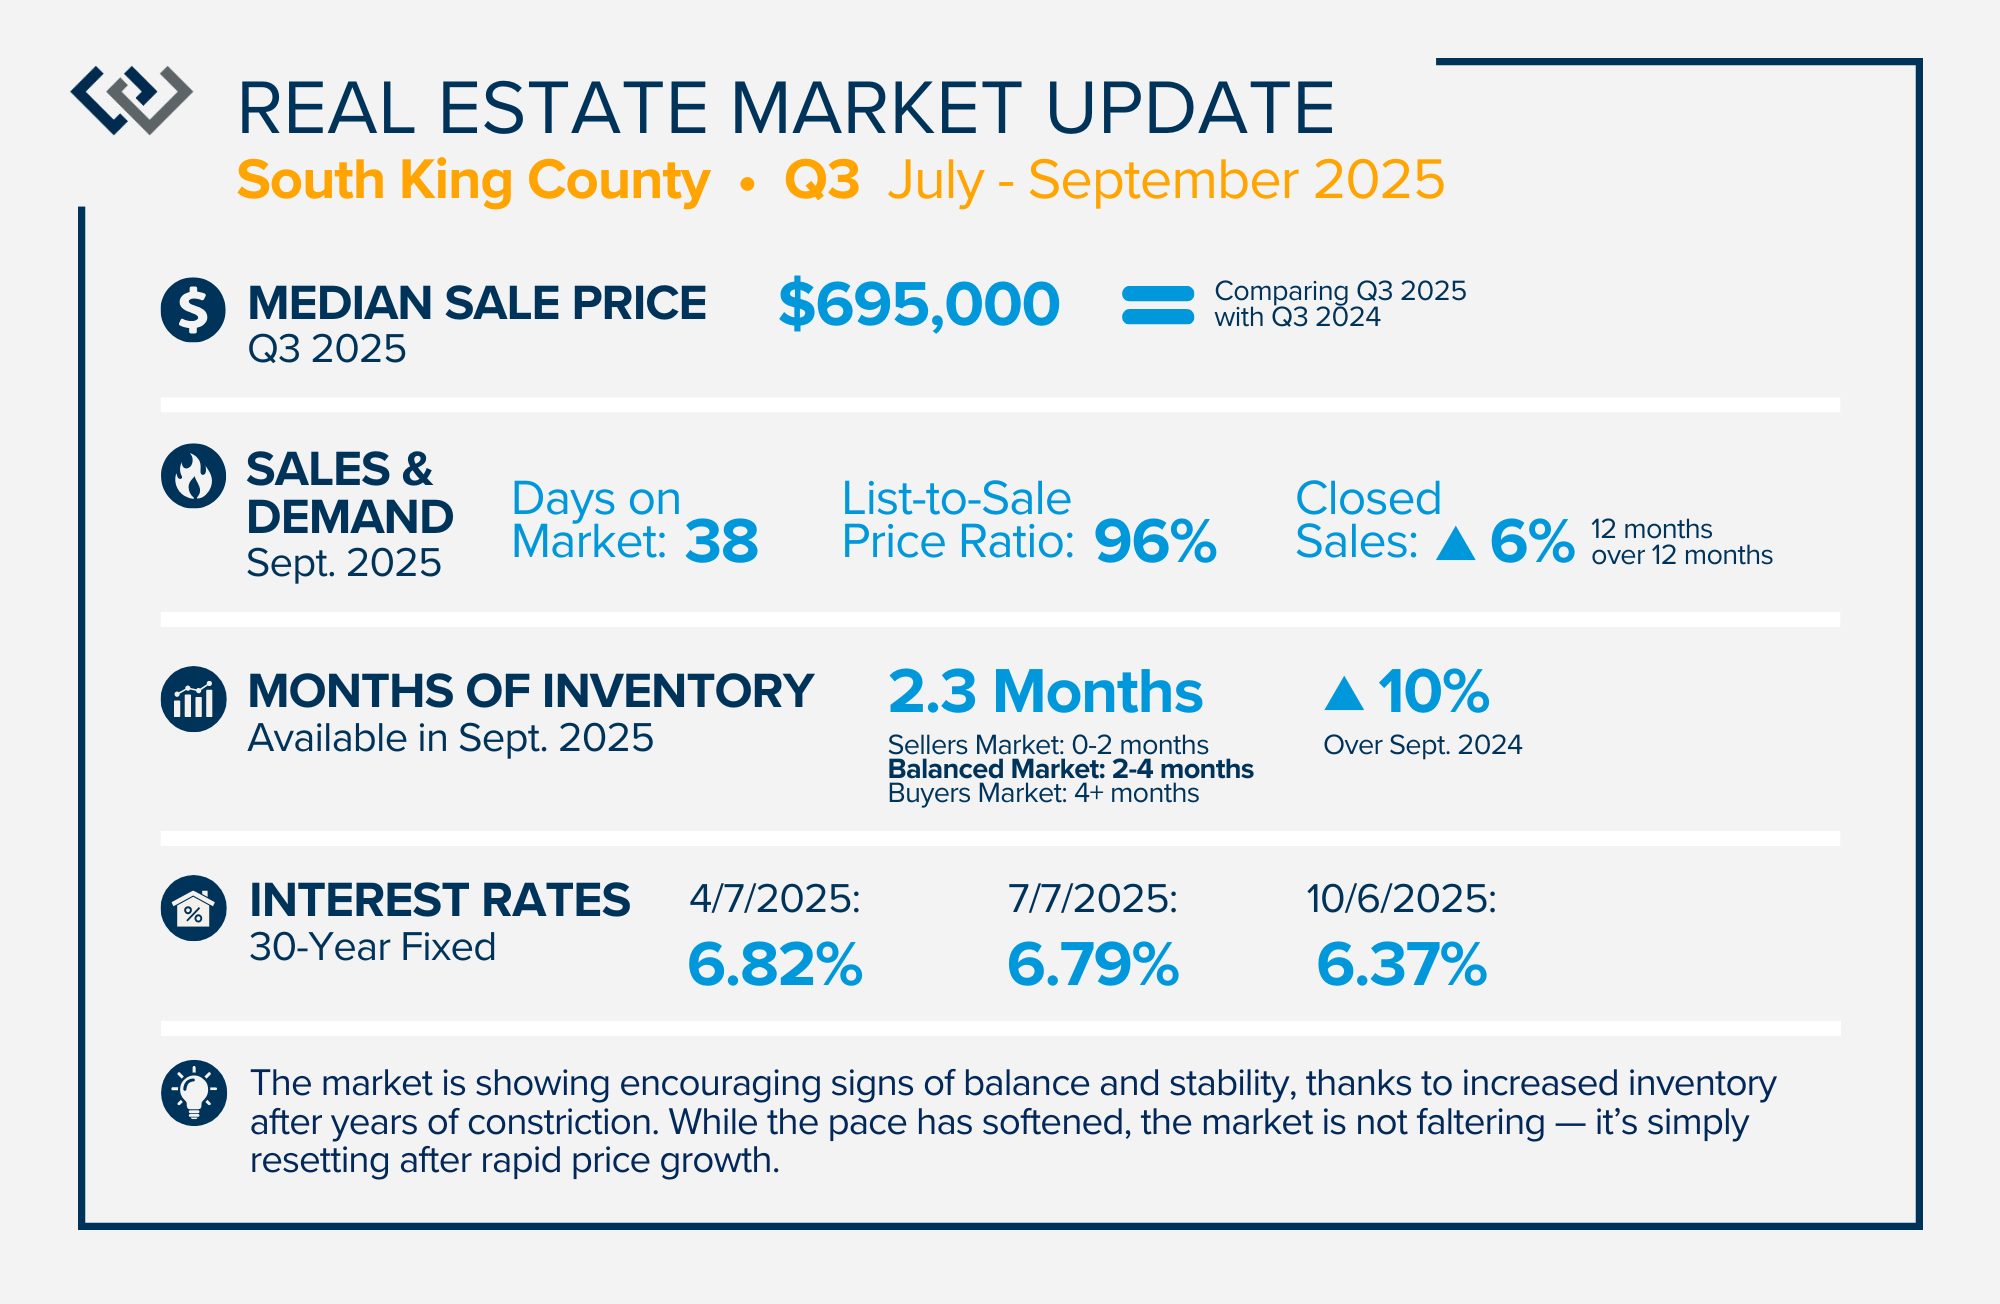
QUARTERLY REPORTS Q3 2025

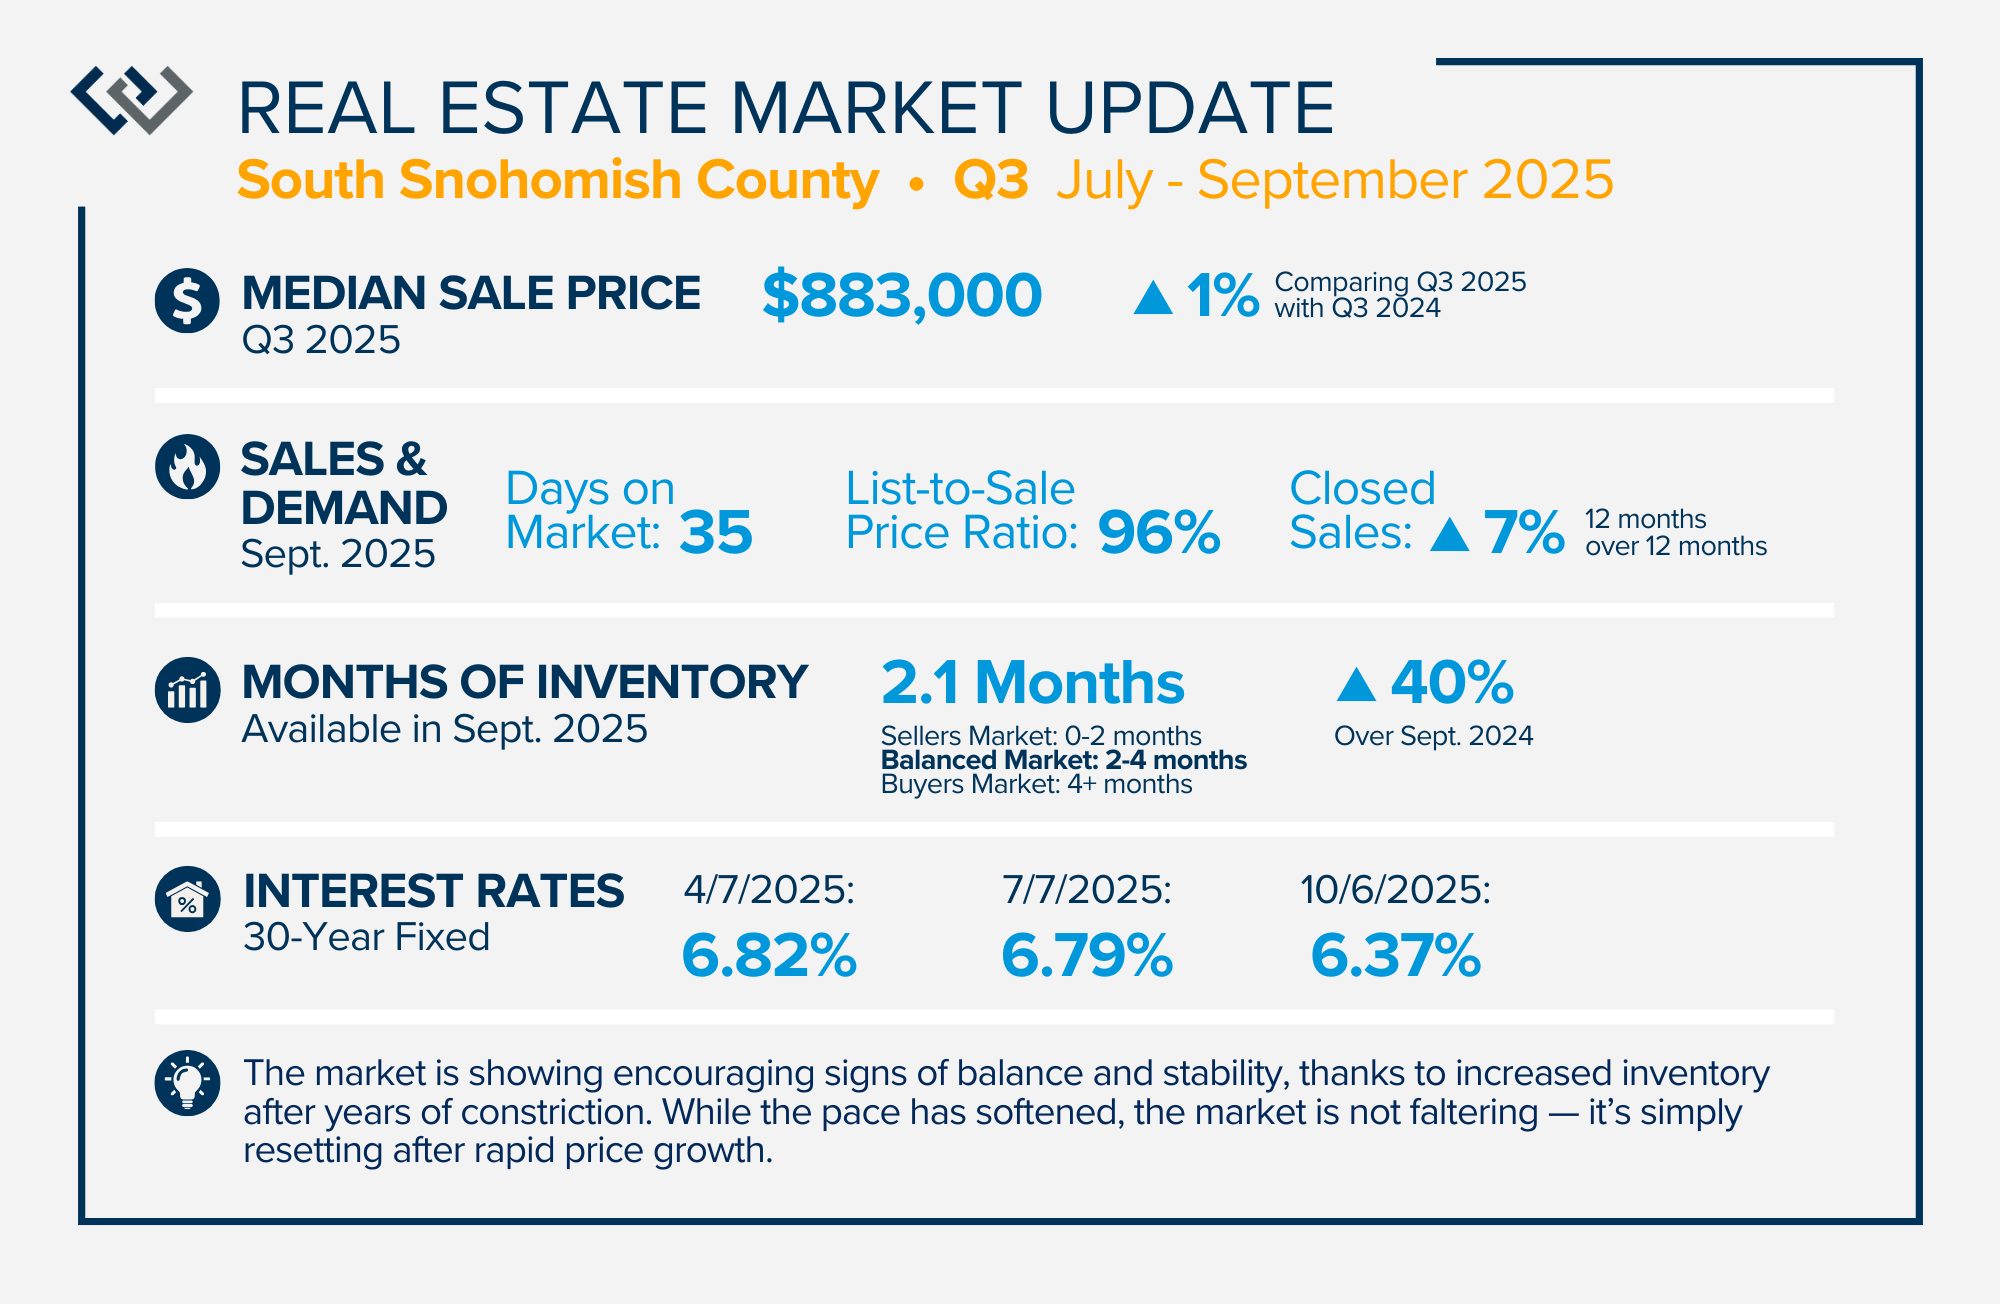
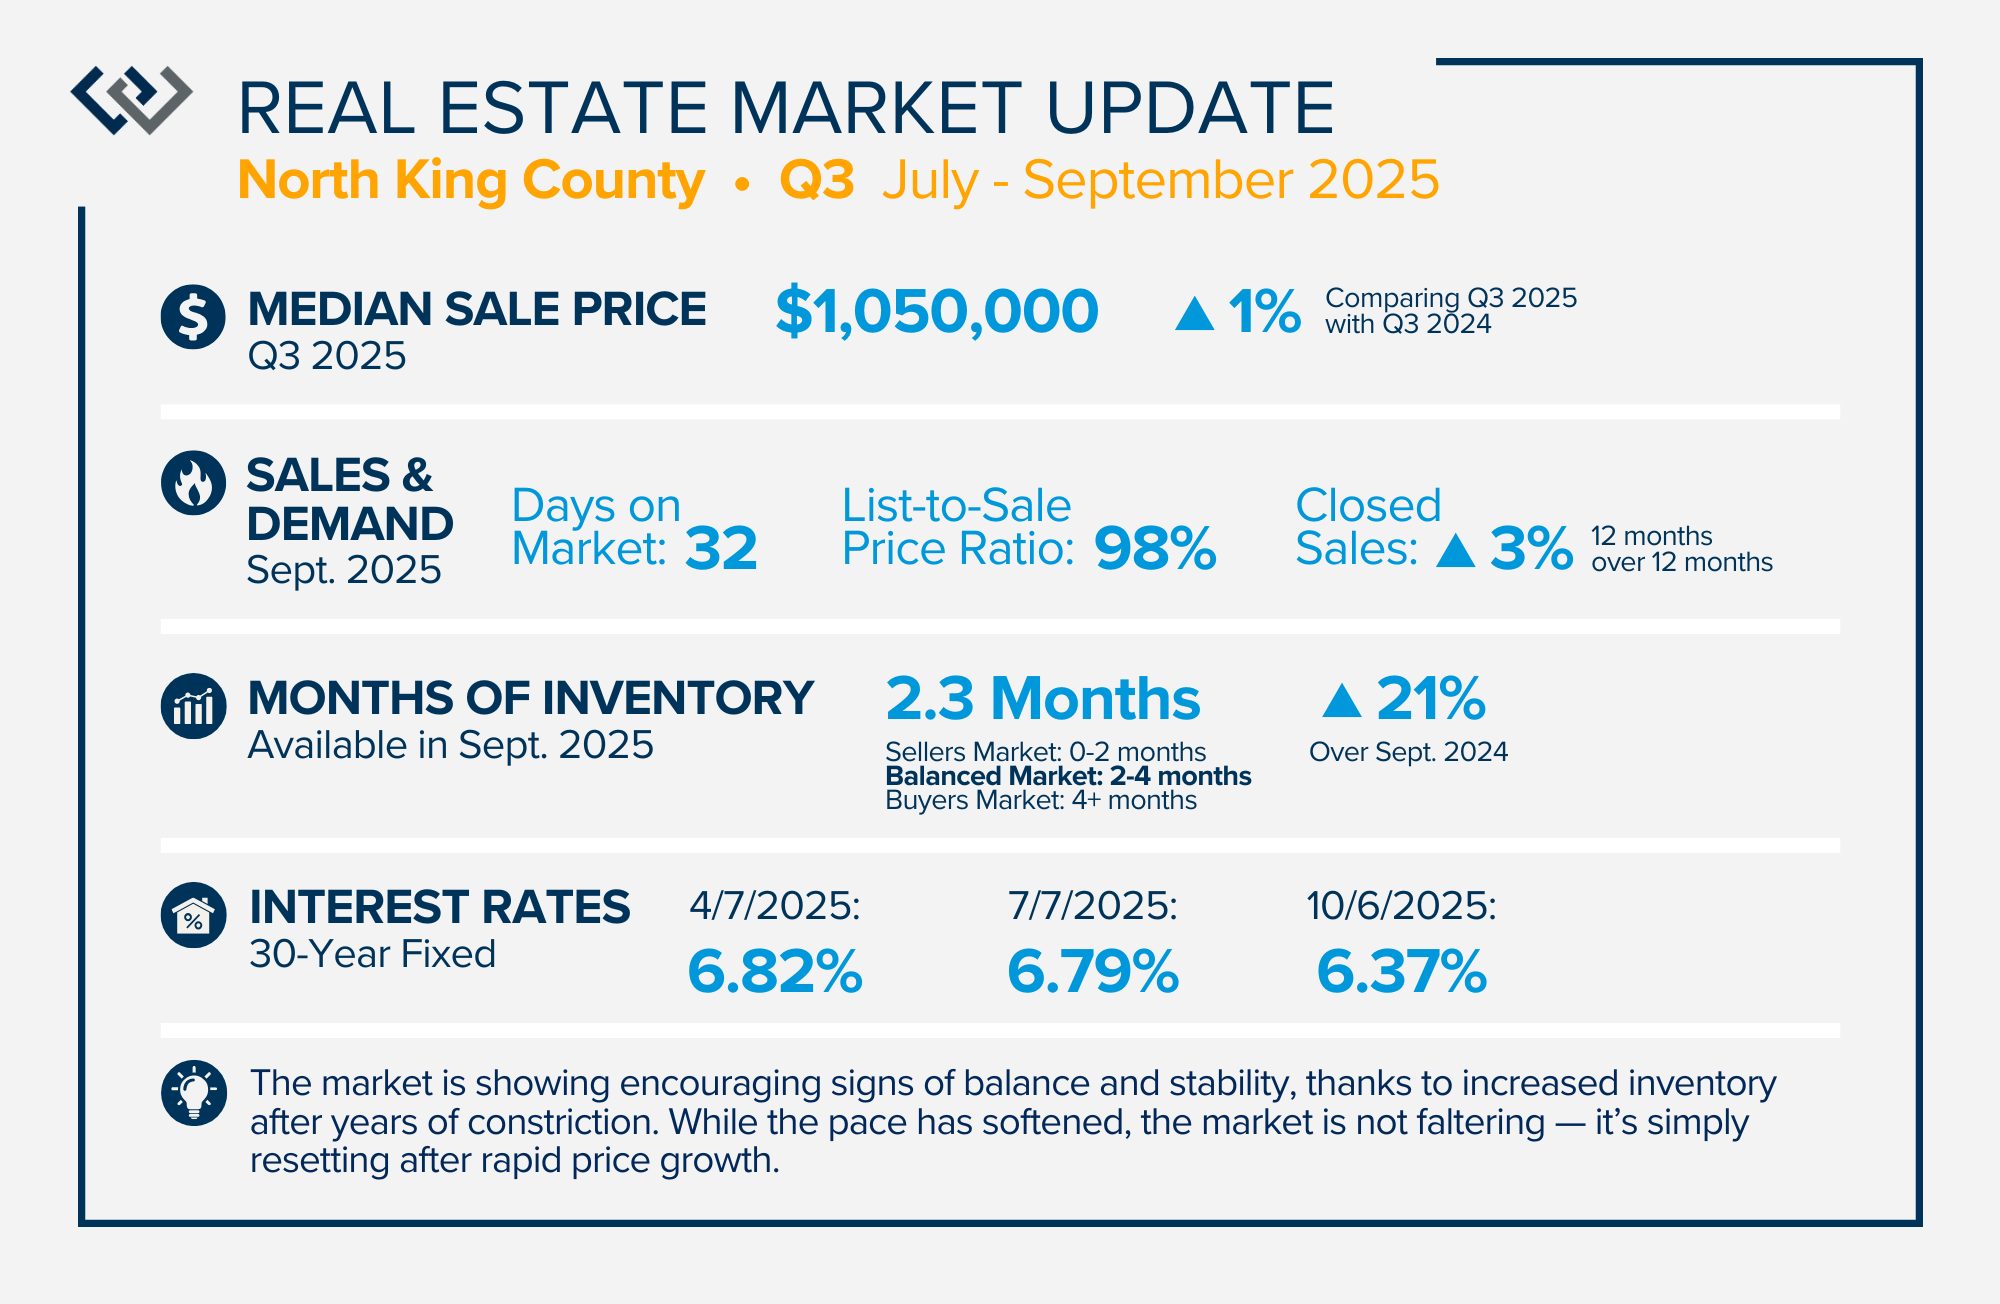
The market is showing encouraging signs of balance and stability, thanks to increased inventory after years of constriction. While the pace has softened, the market is not faltering; it’s simply resetting after rapid price growth. Even with more homes to choose from, the median sale price remains steady year-over-year, and homeowner equity levels are at record highs.
More selection means sellers need to be intentional about property condition and pricing. Now, buyers have breathing room to make thoughtful decisions without frantic competition and are benefiting from easing interest rates and slower price growth.
For both sides of the market, the advantage now lies in strategy over speed. If you’re curious what this balanced environment means for your goals — whether buying, selling, or simply planning ahead — I’d love to talk through your options.
Data Over Drama: Why This Market Is a Reset, Not a Recession

The numbers tell us we’re steady, not sinking. Let’s replace uncertainty with perspective and see how stability sets the stage for opportunity and long-term success.
After years of rapid appreciation, the market is simply taking a breath. Prices are holding steady, inventory is at its healthiest level in over a decade, and interest rates are easing — all signs of balance, not decline. If you’ve been feeling uncertain about the housing market lately, you’re not alone. The media (news or social) loves drama, but the data tells a quieter, steadier story. What we’re seeing right now isn’t a recession — it’s a reset.
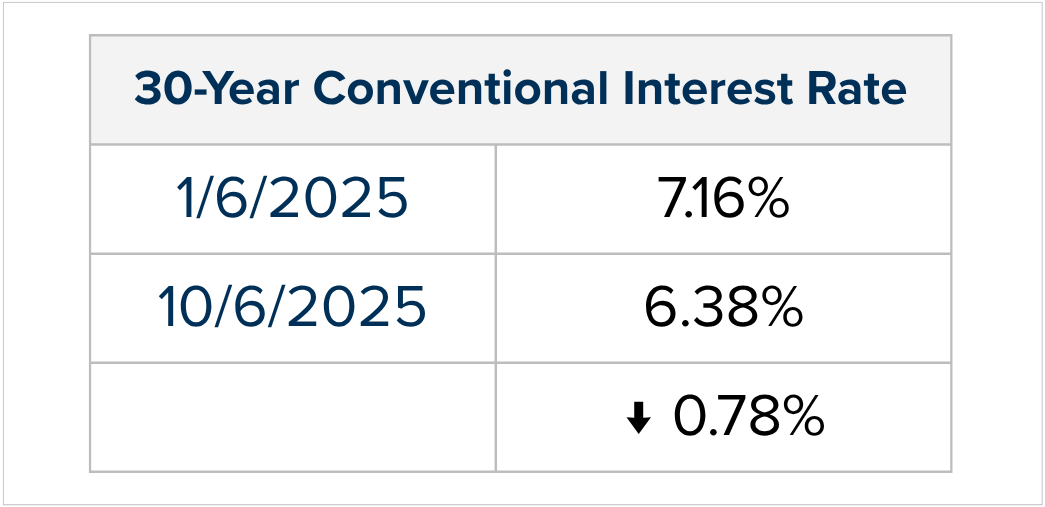
The combination of rates coming down by 0.78% since January 2025 and prices remaining flat year-over-year means that monthly payments for a new mortgage are starting to ease. This is a welcome trend for buyers who have been grappling with affordability. We’ve even started to see buyers who already own a home, willing to give up their lower rate to make moves to homes that better fit their lifestyle needs.
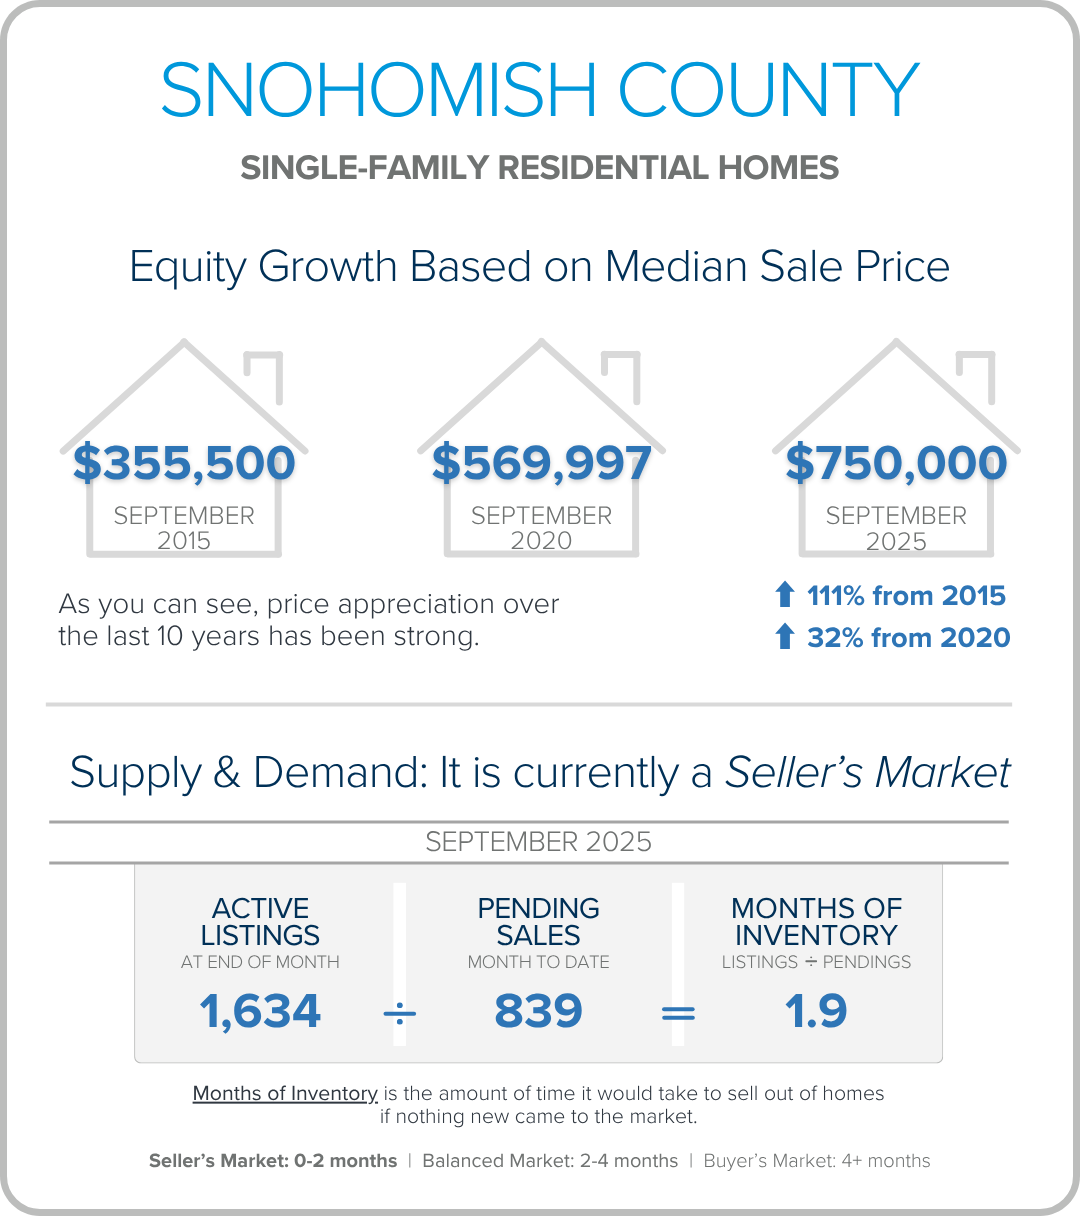
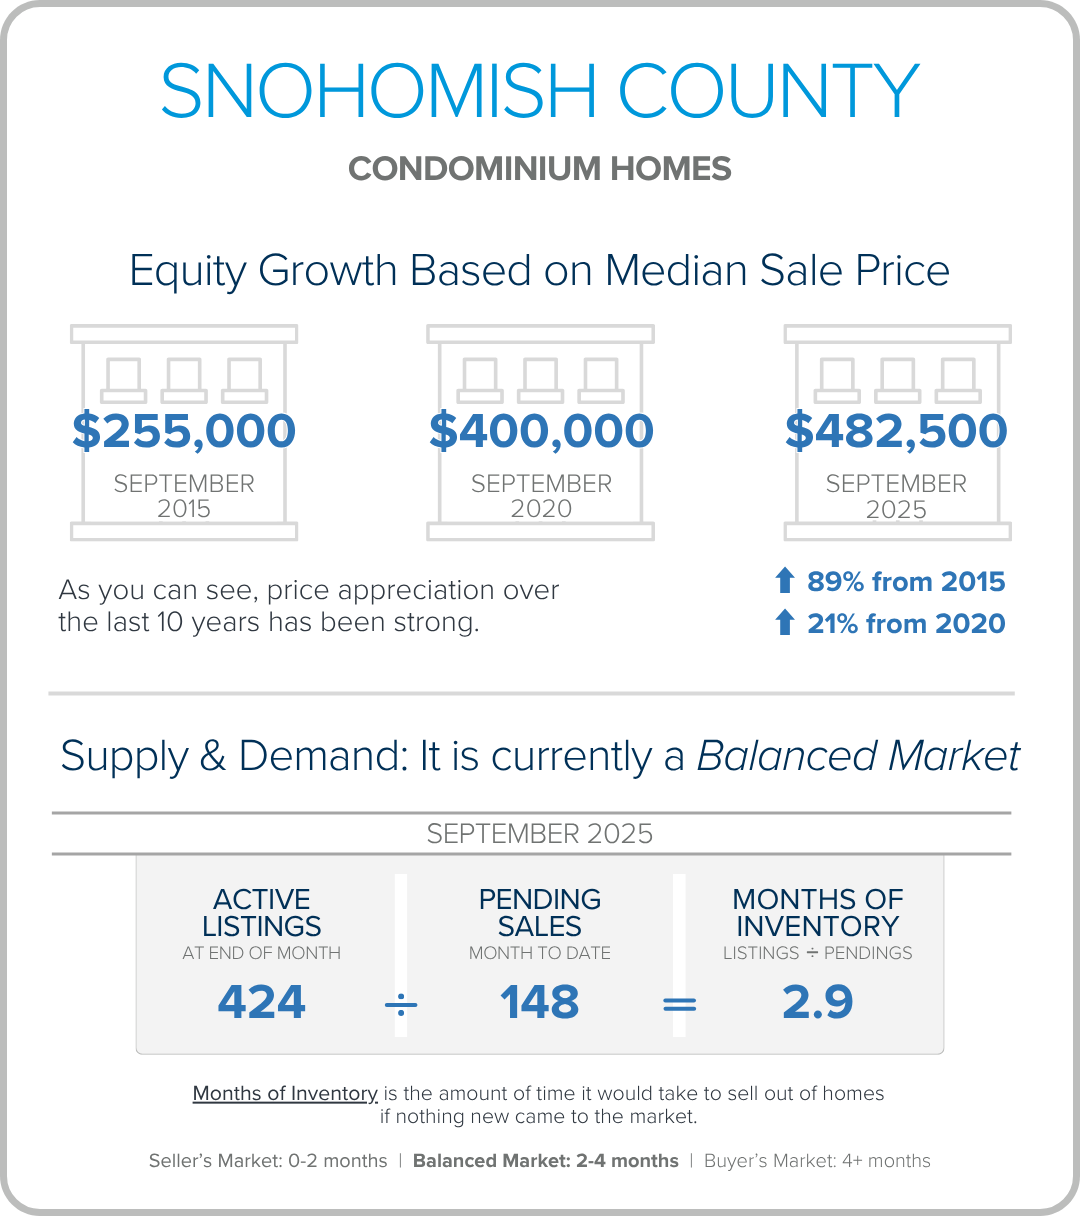
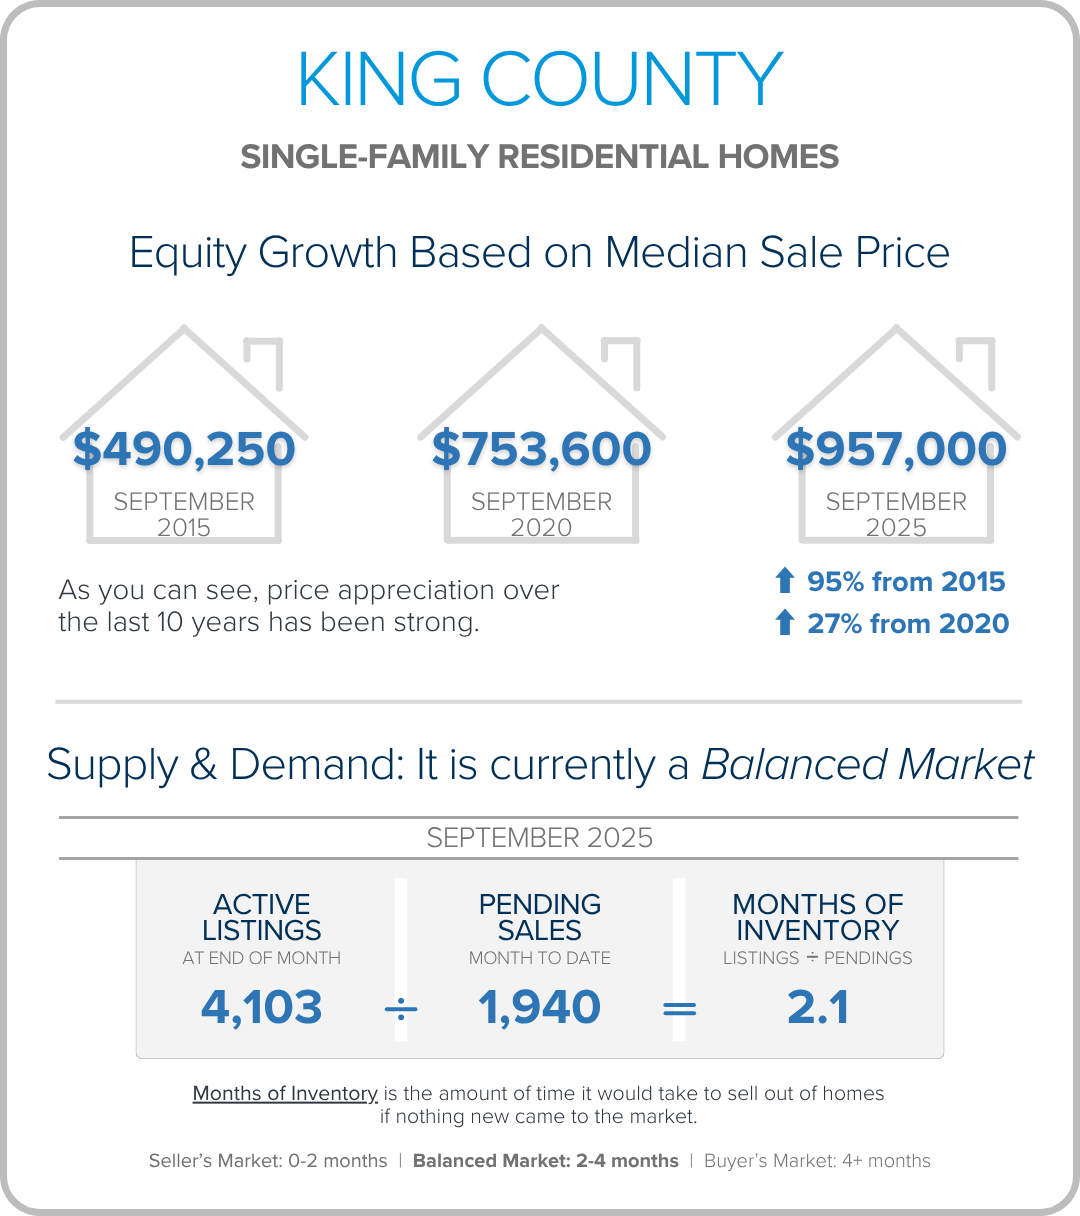
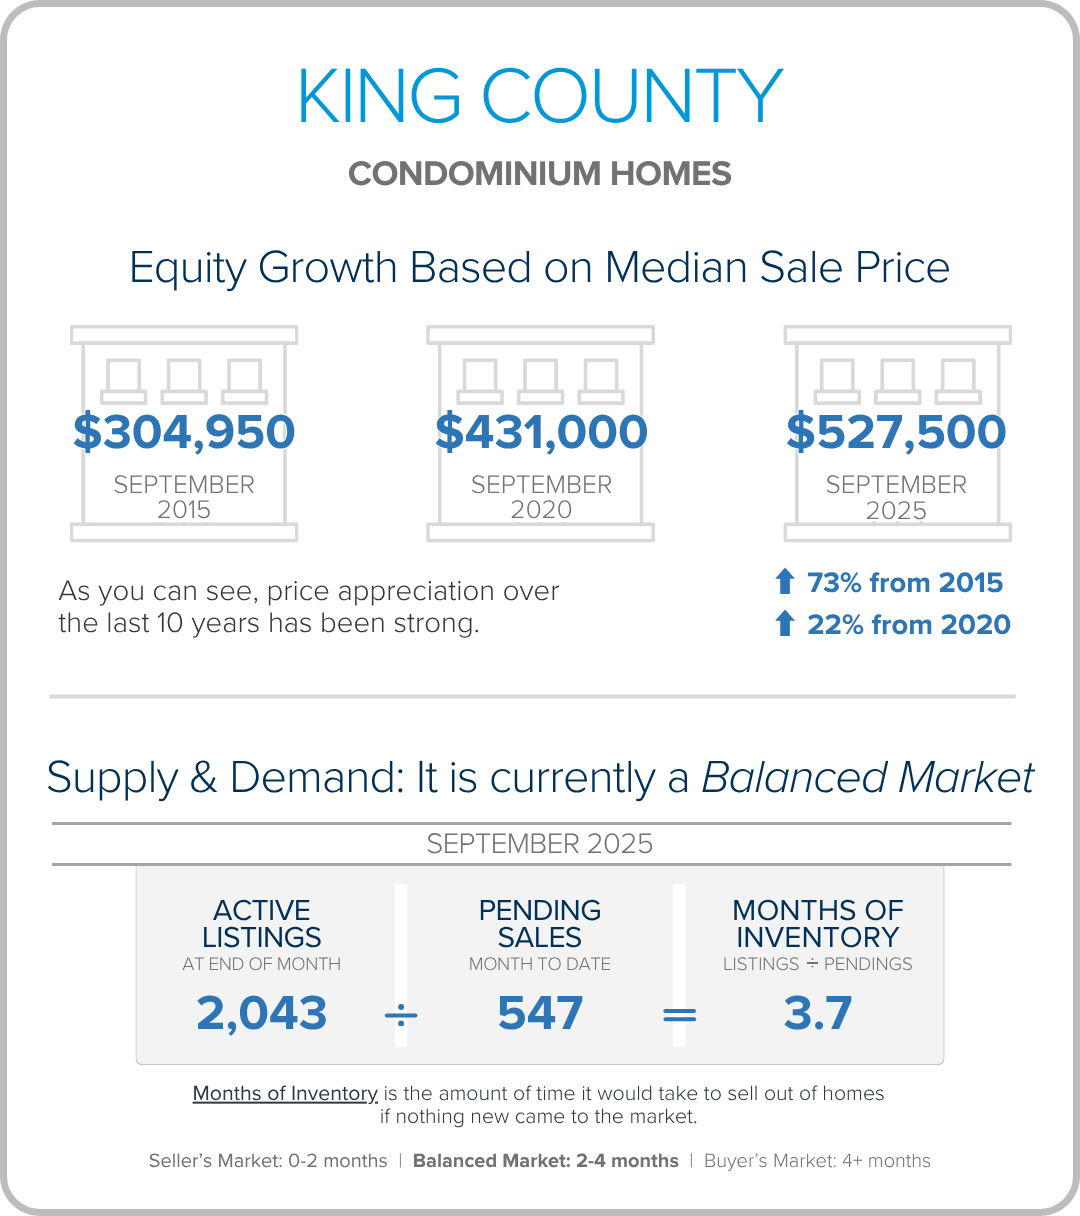
Another reason we are not in a recession is the abundance of equity many homeowners have. Median price in King County is up 33% since 2020 and up 98% since 2015. In Snohomish County, the median price is up 42% since 2020 and up 115% since 2015. During this time, prices grew quickly vs. the historical norms of 3-5% a year. Hence, prices remaining flat makes sense as the market levels out and finds its equilibrium. Further, according to Census data, a record 40% of Americans own their homes free and clear, the highest level recorded.
This kind of “flat” market often feels uncomfortable because it’s different from the fast-paced, multiple-offer environment we grew used to and found exciting. But in reality, flat doesn’t mean failure. It means opportunity — for buyers to make thoughtful moves without frenzy, and for sellers to position their homes strategically in a more stable environment and reap their well-established equity.
In my years of watching market cycles here in the Greater Puget Sound Area, I’ve learned that perspective is everything. For sellers, how long they’ve been in their home, assessing their equity level, and where they want to go are what matters most. A segment of the market that I’ve seen take a step back is speculative sellers hoping to buck the current trends and make a quick gain.
It is important to note that owning real estate is a long-term hold investment and not an overnight come up. The extreme ramp-up in home values from 2020-2022 skewed that viewpoint for some. A valuable rule of thumb to adhere to is the 5-year rule. Outside of the Great Recession of 2007-2012, holding for 5 years has overcome a flat market or any short-term dips in values. It’s also important to understand that your home serves two purposes: your safe place and an investment.
A home is surely an investment, but also a place to call home. It doubles as the place where one finds shelter, makes memories, and becomes a nest egg over time. It’s impossible to “time” the market! It’s more so about matching your home to your current needs, affording the monthly payment, and planning to stay awhile. With those three elements in mind, a successful investment will happen along with living in a home that aligns with your life.
For buyers, we haven’t seen this calm of a market environment and selection in ages. In our region, we are currently experiencing a balanced market (2-4 months of inventory). In some areas of the country, a balanced market looks different (3-6 months), but for our area, it’s tighter due to density, industry, and limited land availability.
While we do occasionally still see multiple offers, they are no longer the norm. Buyers are now afforded the benefit of longer market times, allowing for negotiated contract terms to support performing due diligence over a longer time. They also do not have to escalate as high in price to obtain a home. My hope is that buyers who have sidelined themselves or are considering a purchase realize that this is a great time to buy!
If you’d like to talk about what this balanced market means for your goals — whether it’s buying, selling, both, or just planning ahead — I’m here to help you make decisions with confidence. Following the news, doomscrolling, or listening to an isolated story could veil you from the truth the data provides. While the market might seem “boring” right now, I’ve seen many buyers and sellers find great success. Let’s talk and apply your goals to today’s trends!
